
Thanks to Carl for the kind words and I hope you overcome your challenge. I and many others thank you for setting up this wonderful site and for extracting some extra important data from Dr. Landscheidt’s work.

I am looking forward to contributing to this alternative view on how we interact with the cosmos. I will be reporting on news and scientific papers concerning planetary involvement connected with influencing the Sun and the global climate. Carl’s work has inspired me, and this first article is a work in progress report that was born by his SSB graph which showed to me the importance of Neptune and Uranus. We are living in exciting times and may witness a brand new area of science, especially if we DO experience a Grand Minimum beginning with Solar Cycle 24.
———————————————-
Some time ago while researching some of my interests in areas such as meteorology, the cosmos and perceived man-made global warming I came across this website and in particular a very interesting graph which Carl Smith created showing an extension to Dr. Landscheidt”s work. After studying Carl’s graph it became apparent to me that Neptune & Uranus are responsible for Solar Grand Minima as well as Solar Cycle Modulation.
In this article I will present Solar System Charts and Sunspot charts which correspond with some of the Angular Movements below in Carl’s graph.
The basic theory on how Neptune & Uranus control Solar Grand Minima and Solar Cycle Modulation is as follows: Shown in Carl’s graph below is a wave modulation mainly created by Jupiter & Saturn together (top of wave)and Jupiter & Saturn opposing (bottom of wave) which effectively is the momentum engine of the Sun, the top of the wave is strong, the bottom is weak (weaker means stronger cycle). Every 179 yrs Neptune & Uranus gather behind Jupiter (the largest gravity source besides the Sun) giving it extra momentum force and IF Saturn is on the other side of the Sun, the “down” cycle is shortened and not as weak because of the reduced momentum to Saturn….this coincides every time with less sunspot activity for the last 1000 yrs at least. Just discovered in an extension I recently finished to Carl’s graph back to 900AD is another line up that also causes Grand Minima before the Medieval Warm Period, over time Jupiter and Saturn gather on the other side of Neptune & Uranus causing disturbance at the top of the “wave” and substantially shortening the “up” cycle. Neptune and Uranus are the controllers of the 2 main drivers creating angular momentum, they can add or take away that momentum. The sunspot cycle modulation follows that control or momentum curve as shown in a graph later in the report.
I believe we can now confidently predict Solar Grand Minima and Solar Cycle Modulation strength.

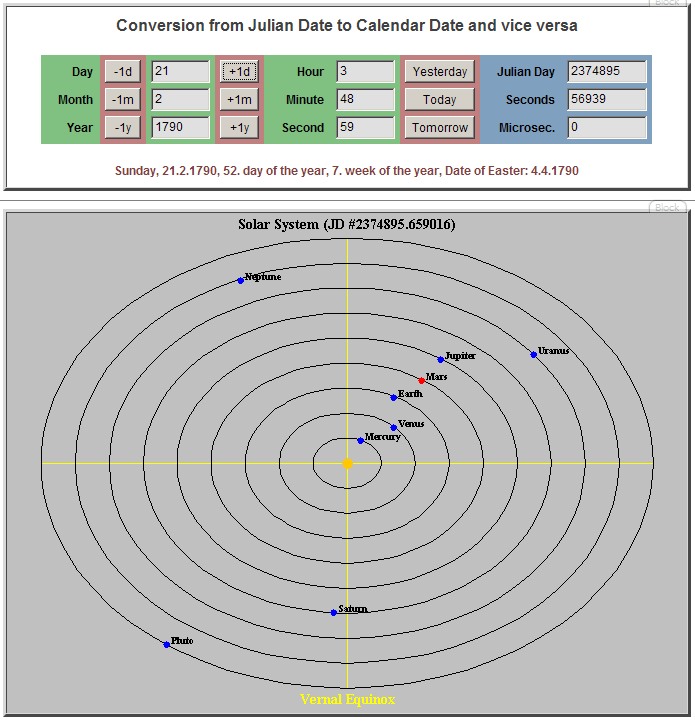
Fig.1 shows the 2 planetary positions that create the majority of angular momentum in our solar system. “A” corresponds with the bottom of the wave in Carl’s graph and “B” with the top of wave. The resonance created from large strength in “B” and near zero strength in “A” as Jupiter & Saturn balance each other out.

Fig.2 shows the 2 planetary positions capable of creating Grand Minima. “A” robbing Saturn at bottom of wave and “B” robbing Jupiter/Saturn at top of wave. Both positions responsible for the recurring “camels humps” in Carl’s graph
Note: Click on the graphs to view a full size image.
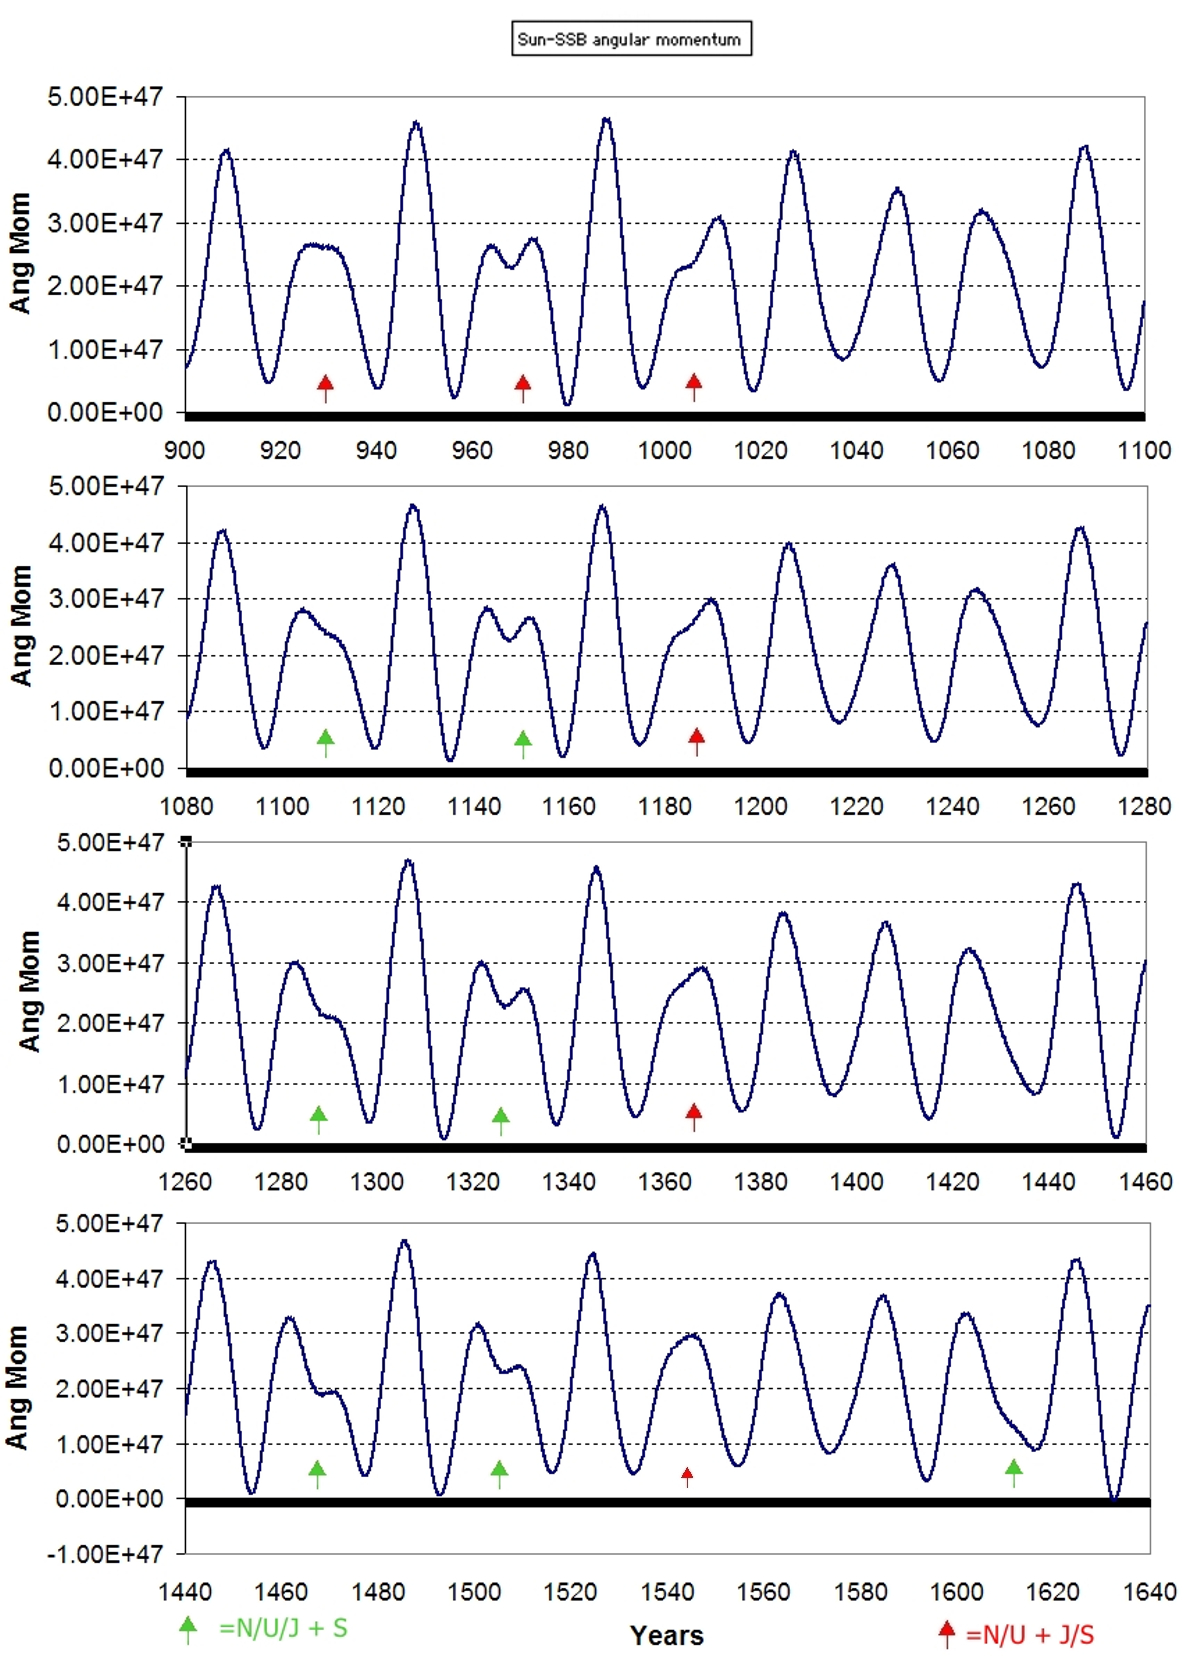
Carl’s original graph above.
Carl’s graph is a representation of the suns angular momentum as affected by all planets of our solar system. The interesting features in particular is the camel shaped humps (green & red arrows) that occur every time during Grand Minima and more recently (967, 1005, 1290, 1470, 1650, 1790, 1830, 1970 & 2010). Researching the planetary positions I found a recurring pattern, it seems that Neptune and Uranus aligning with Jupiter and Saturn opposing (doesn’t have to be in perfect alignment) creates a disturbance which changes the regular pattern. This disturbance coincides with the Dalton, Maunder, Sporer and Wolf and Oort minimums. In the past we had a build up of solar cycle strength immediately before Grand Minima which is due to the extra momentum in the system from N+U. When we get a Grand Minima event, the next 2 cycles after are always very weak even though Angular Momentum is strong, this phenomena is still a mystery but perhaps it simply takes time to “restart the system”.
There are 3 phases to consider but only if the angles of J+S are favorable as N+U start to come together( and I am just discovering that it doesnt happen often, 1280 to now is truly a golden period), basically we have a strong lead up of solar peaks before grand minima event then if the partial line up (1st phase) is strong enough we have grand minima like we did for the Dalton, Maunder, Sporer and maybe Wolf. Next we have 2 cycles of very reduced activity followed by the optimal lineup of N+U+J with S opposite which starts the cycle again until we get the remaining partial line up and if that is strong enough we get more grand minima action. The Sporer and Maunder experienced all 3 phases but the Dalton only endured the first 2 (the J/S angles are now weakening) and thats why we didnt get a grand minimum in SC20 (first phase, partial lineup).
The Oort minimum steps away from the usual pattern because of the weaker lineup of J+S, but shifts to the alternate line up of N+U & J+S opposing . The Neptune/Uranus factor is a lot weaker around the time of the Medieval Warm Period (Jupiter & Saturn not aligning) with very little disturbance (not unlike the overall weakening trend we are starting to experience now), but still I predict a weak solar grand minimum (see prediction at end of report).
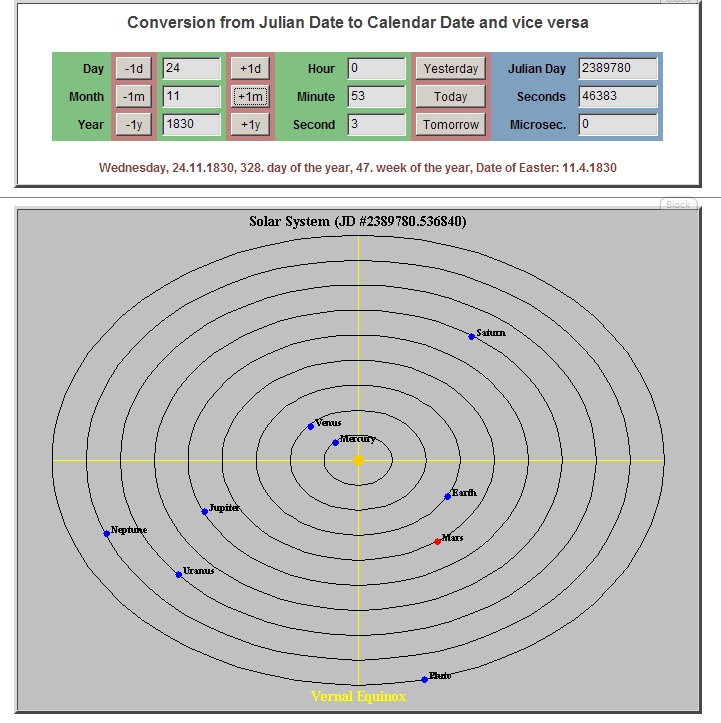
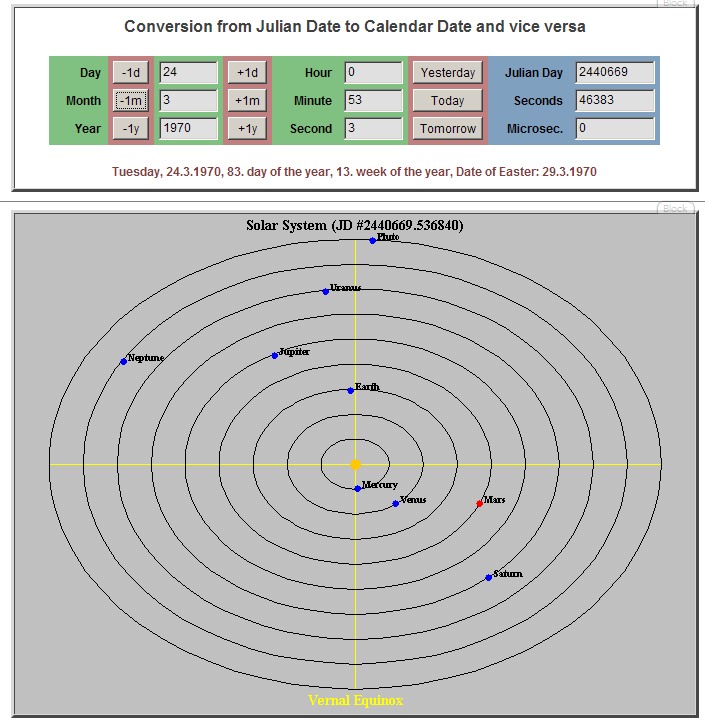
Compare Carl’s Graph to the solar system views below, especially 1651, 1830, 1790 and (2010 near end of report). Note: Solar system views dont take into account the slight elliptical orbits present in the system that do contribute to the overall momentum modulation.

 .
.
This view above also coincides with my birthday
The chart below shows the partial line ups that can cause a Grand Minima Event and if not a large degree of reduced solar activity.
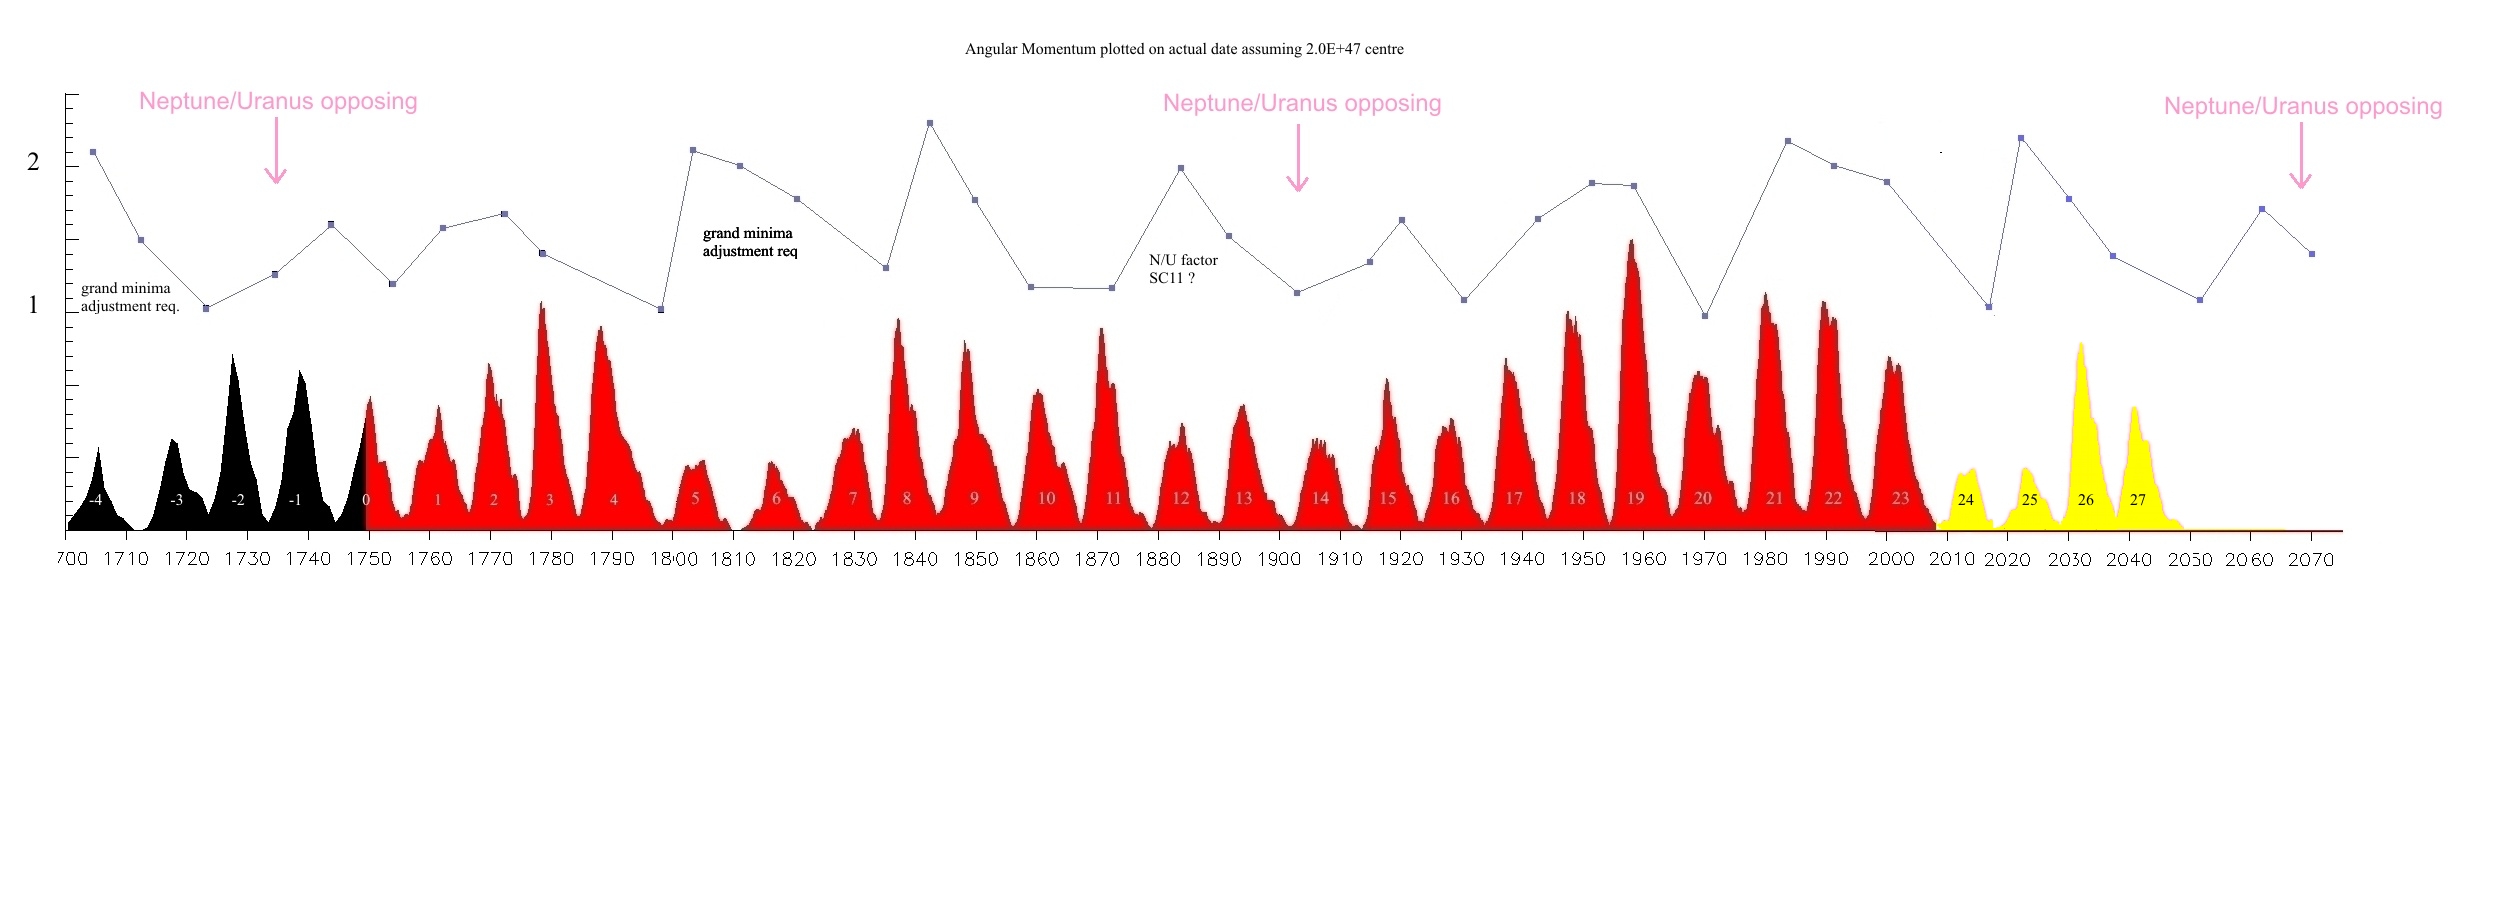
Here is a graph I made showing sunspot peaks plotted against calculated cycle angular momentum and the obvious correlation. No allowance made for inertia or grand minima effects (history shows the cycles stay low for 2 cycles regardless of momentum after minima event).

This graph answers lots of questions, but also creates some new ones. Why doesnt the Dalton continue in 1830. Did SC11 cause SC12 to be reduced (SSB graph shows disturbance). Some might ask why the angular momentum is so high in 1880 right near the opposition of N+U? Answer: All planets create angular momentum and in 1882 they are nearly all lined up except U. Most notable is that there are no high peaks during times of reduced momentum. UPDATE Ian Wilson’s latest paper now addresses these questions, see link here http://landscheidt.auditblogs.com/2009/01/11/does-a-spin%E2%80%93orbit-coupling-between-the-sun-and-the-jovian-planets-govern-the-solar-cycle/
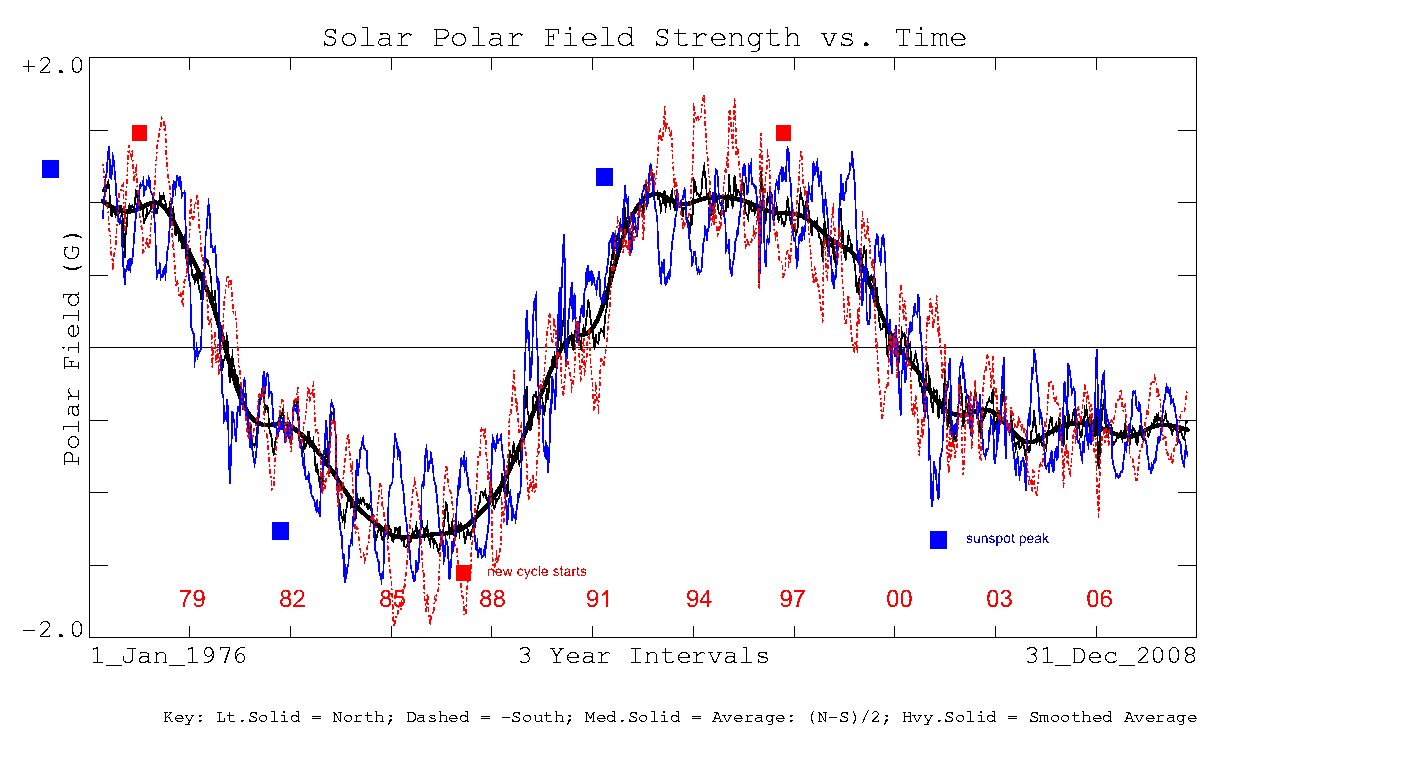
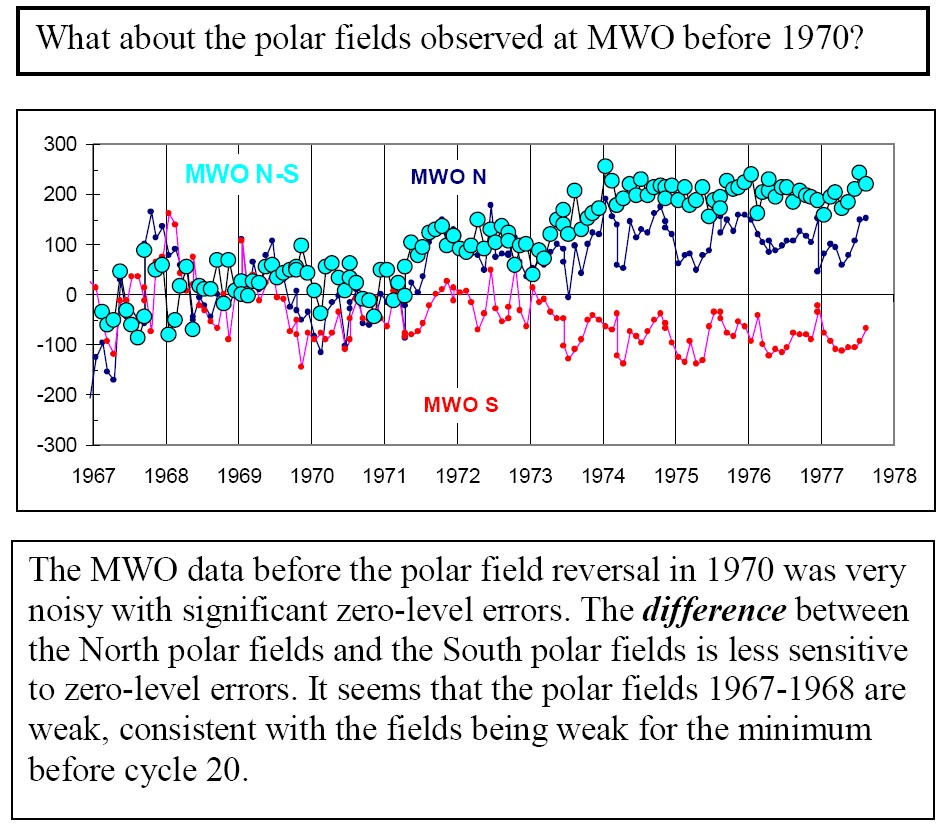
The Neptune, Uranus factor could be effecting the Sun is several ways, perhaps causing a slowdown in the rotational difference at the high and low latitudes thereby reducing the input to the solar dynamo. There are several papers that discuss this observed phenomena during past minima and I am currently researching the differential latitude speeds but finding the data hard to come by. Its also been noted the Solar polar magnetic strength is substantially reduced at present which could be as a result of the rotation change if it is occurring. There are at least 2 papers that talk about a “phase catastrophe” during the Maunder and Dalton minima implying either a period when the solar poles are both the same polarity for an extended period or the cycle goes to 22 years instead of 11, I also think its highly possible that both poles could fluctuate between positive and negative through the entire cycle if the new polar inflows are not strong enough to change the polarity. This could also dramatically slow down the
production of sunspots. As can be seen from the graph below with normal fluctuations and a low solar pole strength that would certainly be possible. It would be interesting if possible to see the polar strength of 1790 but it has only been accurately recorded since 1967, but notice the low polar strength pre 1970 in Dr. Svalgaards’ graph of the MWO data. http://www.leif.org/research/Polar%20Fields%20and%20Cycle%2024.pdf
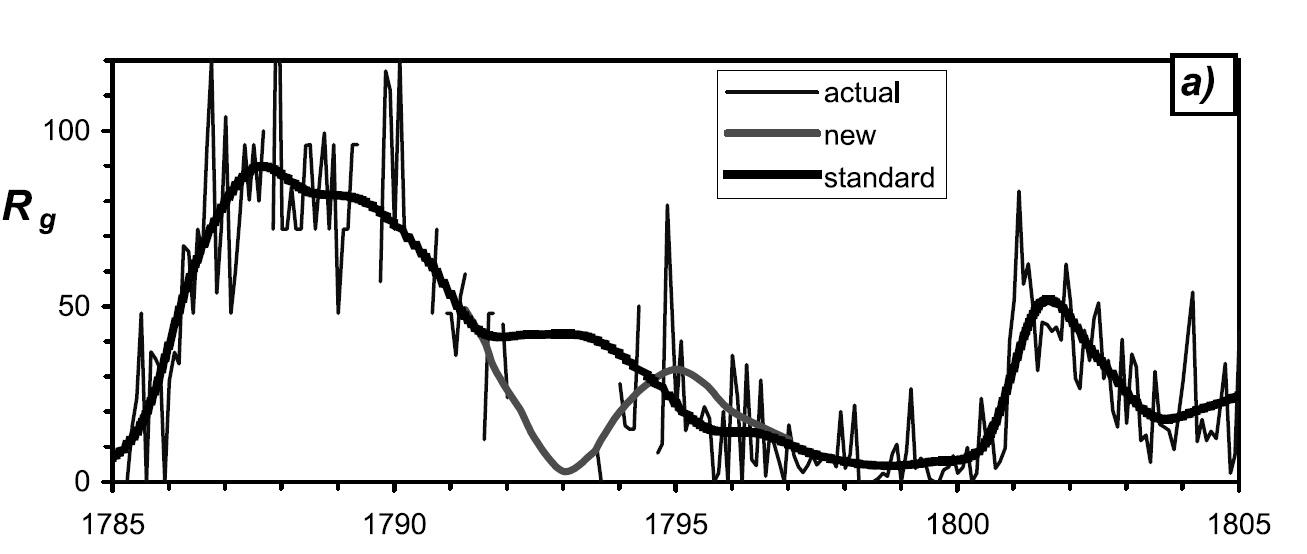
Other points of interest to the theory is SC4 (1788 peak) that lasted perhaps 16 years and is questioned by I. G. Usoskin, K. Mursula, and G. A. Kovaltsov at http://cc.oulu.fi/~usoskin/personal/2002GL015640.pdf as being 2 cycles recorded incorrectly (records before 1850 are considered shaky). The planetary lineup of that period is very similar to today and their revised sunspot group SC4 could mirror SC24.
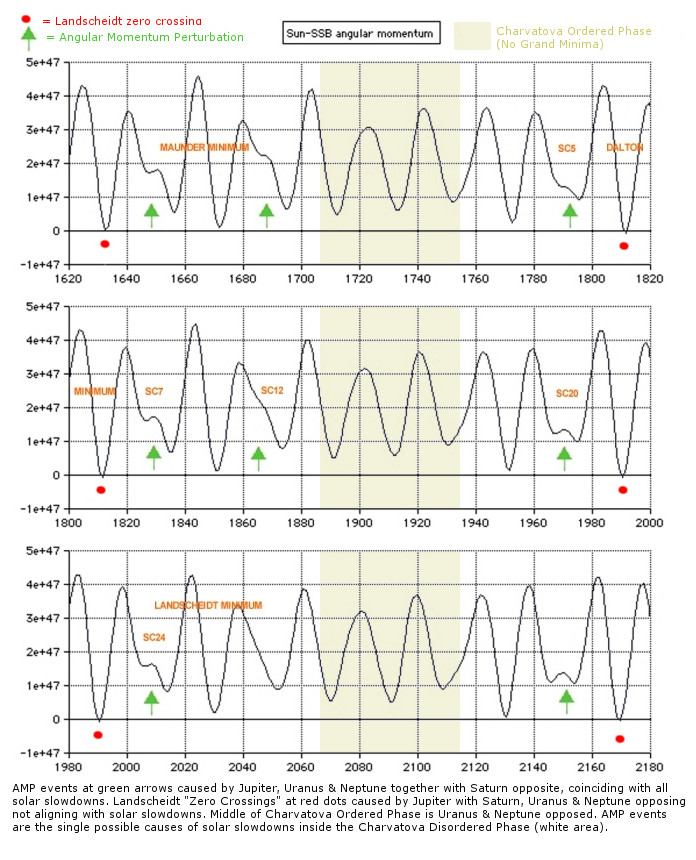
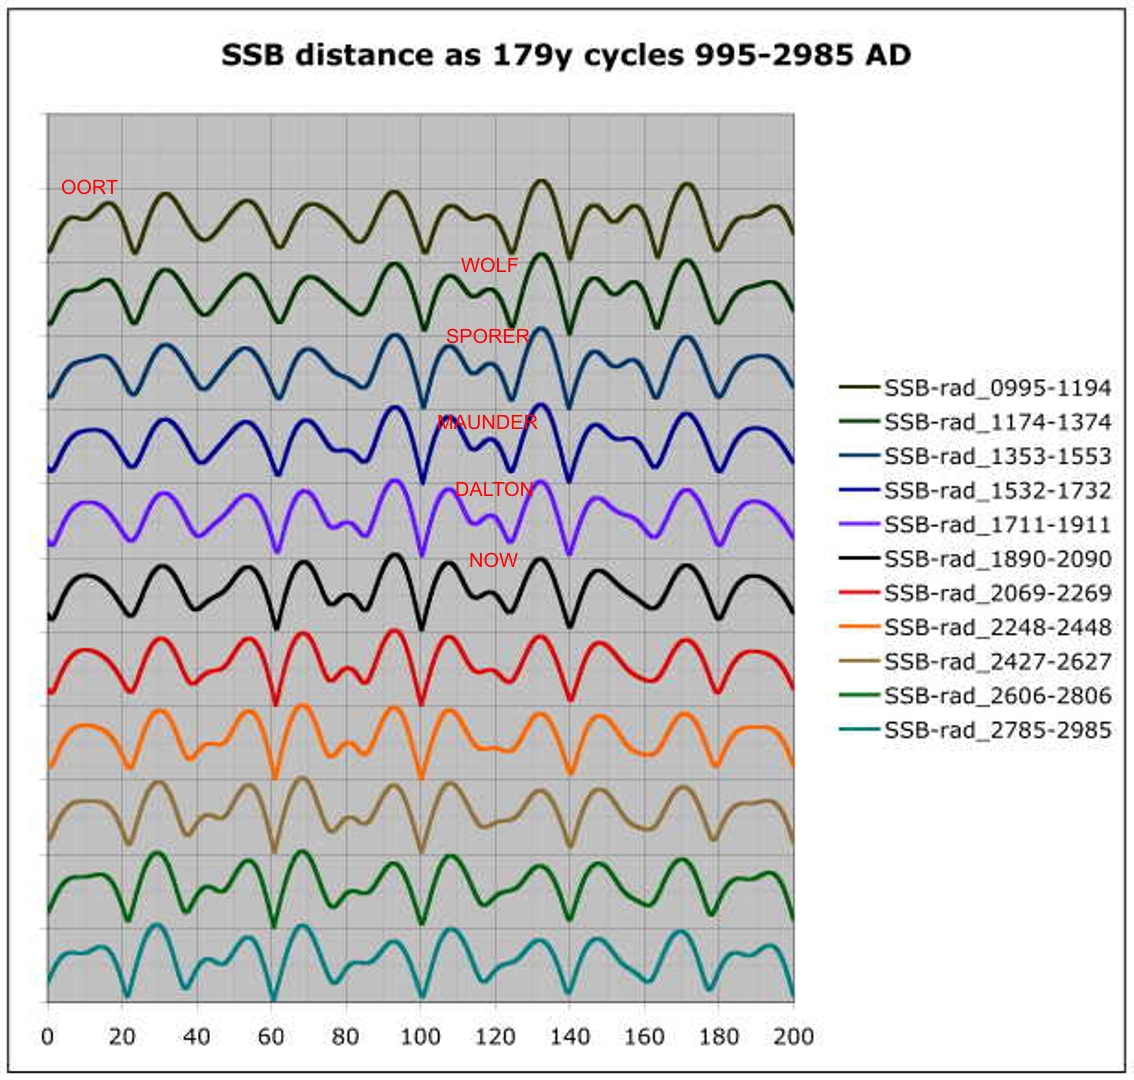
The chart below kindly supplied by Carl shows angular momentum from 995 – 2895. The green arrow represents the optimal line up of N,U,J with S opposite . The Oort minimium steps out of line as the line up goes out of sync, the planets dont quite come back exactly the same each 179 yrs and it seems from the Wolf until now is a window of line ups that might take 1000’s of years to return, during the medieval warm period J+S were poorly aligned as the phase gradually shifted. The MWP could be stated as a phase transition period, further bolstering the theory.
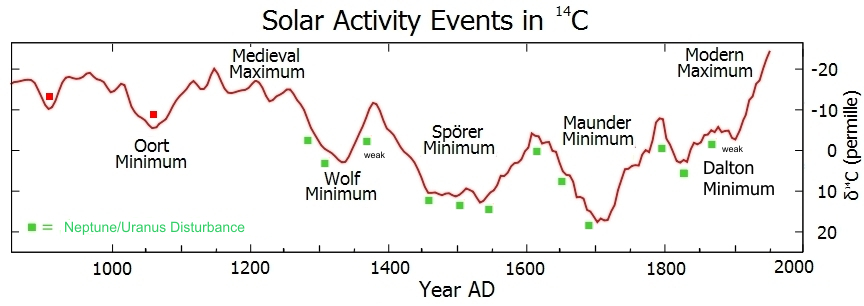
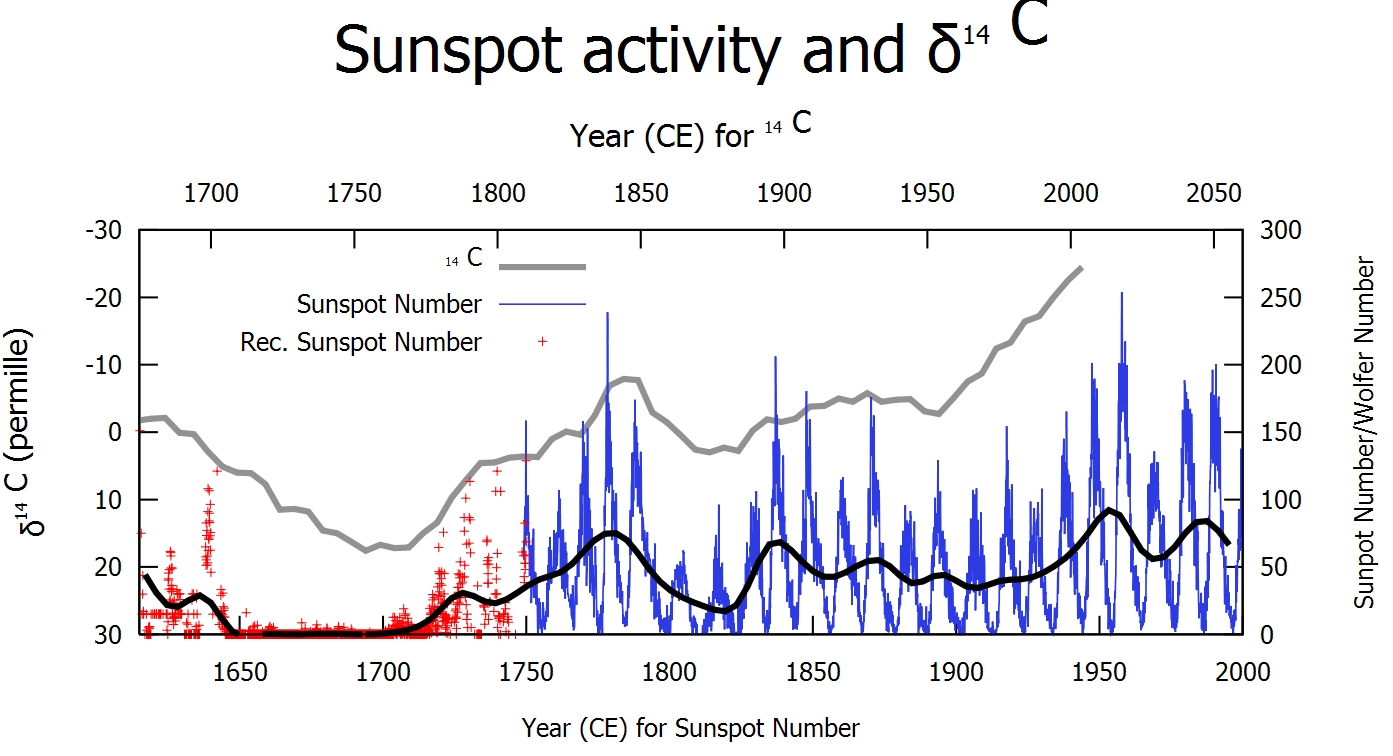
The C14 chart from Wiki shows via the green & red dots the same position as above as the green & red arrows in the SSB graphs. The green dots are the optimal position of alignment and as can be seen the previous minima (Wolf may be in doubt) began at the partial line up state and except for the Dalton continued thru the optimal alignment and on to the remaining partial line up in the phase before returning to “normal”. 1970 failed to be strong enough to start a Solar Grand Minimum explaining the extra heat in the system, SC21,22 & 23 were let off the hook this time. So the typical pattern as can be seen in Carl’s graph above is partial/optimal/partial, but the ideal time for this being between 1280-1830, before and after this period the Jupiter/Saturn alignments begin to weaken and shift. Grand Minima conditions DO NOT occur every 179 years but only if Jupiter & Saturn are in the right position.
As you can see we are due for a slow down if we follow the same pattern but perhaps not as big a slow down as past minima.
Prediction: Some points to digest, the strength of the Neptune/Uranus influence seems to be waning, in the past 4 grand minima the Sun went into Grand Minima on the partial lineup of Neptune/Uranus as can be seen in the C14 Wiki graph and the green squares (also look at Carl’s 995-2985 graph showing the changing trend). This time around we past that stage (1970) without falling into grand minimum and the Dalton minimum shows a weakening trend coming out of minimum not long after the best lineup of Neptune/Uranus (1830) at the time.
Based on this information I predict a short Grand minimum beginning during Cycle 24 which may possibly look like the end of SC23 or be a very low peak in its own right lucky to rise above 50 SSNmax, followed by another low peak. The SC24 peak is particularly hard to predict, the planetary alignments suggest early 2010 or early 2014 but the sunspot peak (see below in Desmoulins and Hung’s graphs) is currently running ahead of the alignments by at least 3 years (Neptune/Uranus doing their thing). Going on history the SC24 peak may get back into line with Desmoulins plot like it did in 1805, if so Feb 21 2010 is looking like a good date, if not early 2014.
UPDATE… Ian Wilson’s latest paper has raised some doubt in my prediction, he has noticed Grand Minima or low cycles always have the conjunction of Jupiter & Saturn before solar cycle max, SC24 needs to have its peak after 2011 to fall into this category, it will be interesting to watch.
There is still a chance that SC24 could look like the end of SC23 like it may have in SC4…this is new ground and if so that will push out or perhaps add another small cycle. Click on the chart to view an expanded version from 1700AD-2070AD
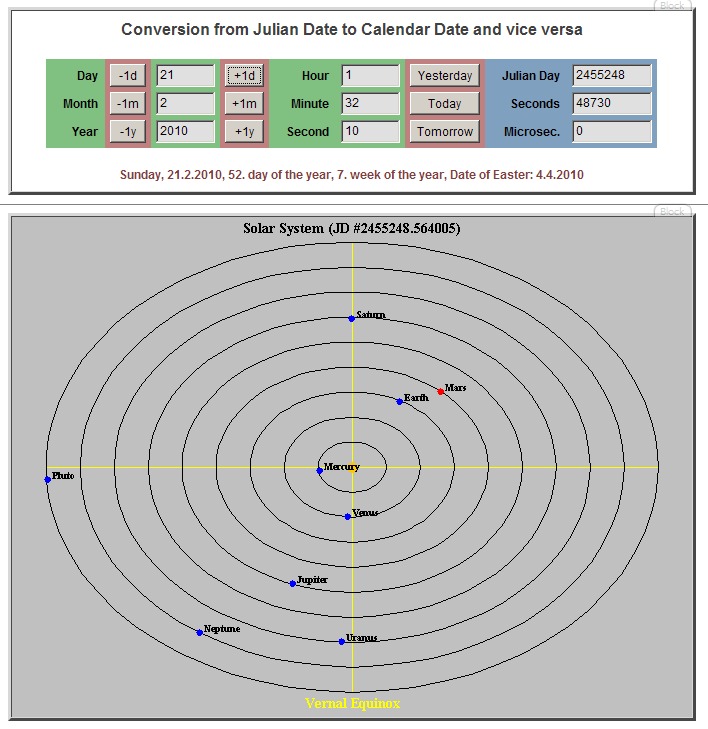
Note the alignment on Feb 21 2010 (also coincides with my birthday) Both Cycles coming together J+V with E apposing and N+U+J with S opposing. (See the J+E+V cycle below)
The SSB and Solar System data has been cross checked.
The Solar System Viewer can be seen at:
http://math-ed.com/Resources/GIS/Geometry_In_Space/java1/Temp/TLVisPOrbit.html
Could Tidal forces control the 11 year sunspot cycle?
Here are 2 pieces of work that look at smaller 11 year cycles (approx) that theorize on Jupiter/Earth/Venus rotations that line up with sunspot cycles.
Here NASA has reported on possible links between sunspot cycles and the planetary movements http://gltrs.grc.nasa.gov/Citations.aspx?id=330
EDIT: The NASA paper basically looks at the Heliocentric sysygies of Jupiter, Earth and Venus and how they line up with sunspot peaks. Jean-Pierre Desmoulins has also done some great work on his site http://pagesperso-orange.fr/jpdesm/sunspots/ where you can view this graph below showing that alignment (green peaks are J+E+V most aligned with the Sun and solar cycle peaks shown in red). Notice how the alignment gets slightly out of sync around 1790 and now, when out of sync we experience much less solar activity…Neptune and Uranus are close together at these times possibly dragging the sync out of line but it should return like it did in 1805. Certainly worth further investigation.

The table is a plot of J+E+V alignments with each date corresponding with the green peaks on Desmoulins graph above. The odd cycle numbers are J+V with E opposing and even is J+E+V aligned. The G/O rule keeping mainly true. These alignments naturally include the Sun.
A Similar graph from the NASA paper below.
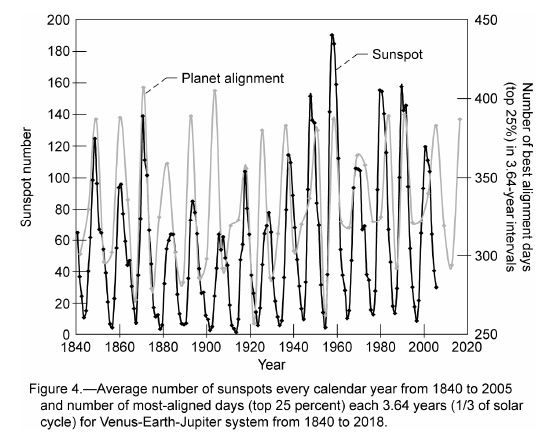
The compelling evidence is that both graphs plot 2 cycles that although slightly different in length remain in step with one another.

Hi,
The new blog theme is really nice. But why use gray fonts instead of a much more contrasted black ?
I have good eyes and a good screen but when I see gray on white, I run away !
Reply:Thanks for your feedback, I am currently investigating suitable themes that allow some personal choice in headers etc. Stay tuned and hope it doesnt upset too much.
Geoff, I am sorry but I do not agree, referring back to posts, 23, 26 and 28 on the cycle 24 prediction thread, I have described how the result will be positive when Jupiter is in line with the best heliocentric opposition of Saturn against Uranus and Neptune, such as it was during the MWP, and some 1000-1200yrs before that also. The worst negative results occur when Jupiter is square to the other three, this is what is has recently occurred on a looser alignment through 2007/8, with the accompanied drops in solar activity, global temperatures and cyclone numbers. Watch the rise happen over the next two years as Jupiter gets back into line with Saturn and Uranus, especially late 2010.
Ulric….I guess there are a few camps in this field of prediction and it will be interesting to follow the progress of SC24 to see who is right.
I also think there is more than one planetary influencing cycle on the Sun.
1.The Jupiter, Venus, Earth sysygy could be the driver on the 11/22 year sunspot cycle and certainly remains in phase with the sunspot groups for the last 300 years acting as a harmonic. The sunspot cycle could be modulated by Saturn or others ( Anyone that can work out the gravity numbers inline with the sysygies is very welcome to email me ).
Its interesting to note the sunspot group/sysygy correlation does seem to drift apart as Neptune and Uranus come together.
2. The Jupiter, Neptune, Uranus conjunction with Saturn opposing seems to be the main driver for Solar Grand Minima and has a different effect by possibly slowing the solar dynamo and sending it into a state of “Phase Catastrophe.” This is very different and separate from the Jupiter, Venus Earth sysygy in my opinion, but working with it.
So my prediction is based on the Sun entering a similar phase.
Lets stack up the teams:
The High team (above SSNMax 80): Hathaway, Dikpati, Lyons.
The Low Team: Landscheidt, Archibald, Svalgaard, Schatten, Livingston & Penn, Sharp.
Any further suggestions for team members?
Geoff, for me its not about camps, its about doing the science right. Late 1648 is the best opposition of Saturn against Uranus and Neptune, see how square Jupiter is to the other three at this point. Next look to late 1848 for the tightest opposition of Saturn against Uranus and Neptune, you will see Jupiter not quite so square, but definitely not in line. It is best to study this with an astronomy program that you can animate, rather than an on line solar system simulator. I have done a huge amount of correlative studies of all types of configurations against all kinds of data sets, and can assure you that Jupiter square to the other three is the negative configuration, and you have your dates incorrect for the alignment center or focus, hence you thinking Jupiter needs to in-line with the other three to produce the negative (cold) anomaly.
You may also look at the relative positions of all four at 789AD, 967AD and 1147AD and see how Jupiter tends to be more in line with the other three, rather than square as in 1648 and 1848, and also how loose the oppositions of Saturn with Neptune and Uranus are, 20yrs or so either side of 1306AD. This is all highly relevant to the warmer periods over these centuries.
Modulation of the amplitude of the sunspot cycle by the relative positions of all the gas giants with each other (ie. including Jupiter) is observable in ways that can be described in terms of position `rules` or `logic`.
It could be assumed that the level of each cycle affects its position relative to the Jupiter/Earth/Venus syzygies, so that a strong cycle rises fast and possibly peaks before the J/E/V syzygies, with a shorter cycle, and a weak cycle rises slower, and peaks past the J/E/V syzygies. But how do we quantify how much by?
Well interestingly, I have recently noticed that EVERY minimum and maximum actually will tend towards typically a syzygy of the outer planets. this syzygy can involve from two to all four of the outer planets. occasionally it can occur on a complex square involving at least three of the bodies.
I think at present there is no real science that can predict further than a few years in regard to sunspot predictions, and there seems to be 1 group predicting SC24 to be greater than SC23 and the other group predicting substantially less than the SC23 peak.
The difference of Jupiter being square or aligned is only about 3 years and you might be correct saying Jupiter square is a weaker position but the peaks at 1790, 1830, 1970 and 2010 on Carl’s graph (which I consider crucial) do line up with the position I stated (Jupiter aligned). My theory is that the balance is disturbed in that position as Jupiter gets assistance from Neptune and Uranus which only happens every 179 years (with partial line ups before and after) and that disturbance causes a reduction in polar strength because of reduced differential rotation. If that starts to occur 3 years earlier because of Jupiter being square it still agrees with the theory, so we are probably agreeing on the general thrust. But I think as it has done before, this alignment will cause a slow down not ramp up of solar activity.
We wont have to wait too long to find out.
I find this tool very useful http://math-ed.com/Resources/GIS/Geometry_In_Space/java1/Temp/TLVisPOrbit.html
Just to butt in for the moment, I think the claims concerning angular relationships can be tested quite easily using ephemeris data and some simple formulae.
From what I can see, using a spreadsheet, a time series index of the Venus, Earth, Jupiter syzygy alignments could be generated by the formula:
idx=(1-abs(sin(J-V)))*(1-abs(sin(J-E)))
- where J=Jupiter, V=Venus, and E=Earth
- all values are ecliptic longitude in radians
- full syzygy = 1
- this curve plots as a series of sharpish alignment spikes
- substitute other planets to generate other indices
- adding pi to J could be used to generate a 90 degree out-of-phase index
- indices can be scaled to any convenient value and offset for graphing purposes
Such indices could be correlated against the sunspot record or any other measure of solar activity to see how much they explain, and for further investigations various planetary indices could be combined in weighted schemes.
Anytime Carl….
Its a bit beyond me but I wonder if that equation could be used to plot the Jupiter, Earth, Venus sysygy peaks and take into consideration the effect of the other planets. Perhaps then we wouldnt have the out of sync function as is happening now as shown on the first and second graph of this article
Yes, the basic equation can be adapted to suit many things – you could also do various other 3-way indices such as J-S-U, J-S-N, J-U-N, etc, and find ways to weight and combine the indices to see how they add/cancel each other over time etc..
I am sure there is some very interesting things waiting to be discovered in amongst this stuff … just wishing I had plenty of time and energy to explore it …
Geoff, ref. post 5, firstly you said; “I think at present there is no real science that can predict further than a few years in regard to sunspot predictions”, but we are both making predictions that are based upon alignments that may not re-occur for 171-179yrs, so if any are correct, then surely predictions should be able to be made at least that many years in advance! Your dates 1650 and 1830 do have Jupiter with Uranus and Neptune but Saturn is not really opposite them any more by then. As for 1790, 1830 and 1970, sunspot levels on and around these years are not particularly low, nor are temperatures, in fact 1826 to 1834 was a very warm period, apart from a brief dip at 1829, but this is not unusual to have some stronger negative anomalies at the sunspot cycle maximums. It is previous two sunspot cycles, C5 and C6, where much lower sunspot numbers, and much lower temperatures occurred. Around 1790, both temperatures and sunspot levels are fairly high, and around 1970, very average, no grand minima here.
REPLY: Most of your points are covered in my article in detail….perhaps you could read it more carefully, also lets not confuse theory with science.
I did read it again, but I just seem to find more problems. You wrote;
“Notice how the alignment gets slightly out of sync around 1790 and now, when out of sync we experience less solar activity…Neptune and Uranus are close together at these times possibly dragging the sync out of line?”
There was not less solar activity around 1790, and Neptune and Uranus were almost square to one another then. You wrote:
“The interesting features in particular is the shapes that occur on a 179 yr (approx) intervals especially preceding the Dalton and Maunder Minimums (1650 & 1830)” and “Dalton minimum shows a weakening trend coming out of minimum not long after the best lineup of Neptune/Uranus (1830) at the time”
The Daulton minimum really was from say 1799 to 1820, many years before 1830, and from 1821, the exact point of the Neptune and Uranus conjunct, it warmed up considerably. This, or any other minimum can not be plotted by the positions of Jupiter or Saturn in relation to Uranus and Neptune alone, as they are not in any given position long enough, something else is at play. Also, I still do not agree with the planetary positions you describe, Neptune and Uranus coming together with Jupiter with Saturn opposite occurred best at 395BC, 255BC, 215BC, 76BC, and 104AD, through the MWP it was N+U opposite S+J, through the LIA it was N+U opposite S, square to J. By about 2150 they will return to positions very similar to 2225 and 2403 years earlier, ie. 76BC and 255BC.
Carl, Ulric and Geoff.
Is there any way to send in a graph (plot) that might shed some light on the possible causes of the Grand minima? I wil email the graph
to Geoff and he might be able to post it up on this blog.
I know that this comment may not be welcome but just showing that two phenomenon are coincident is not a proof that the phenomenon are connected. This does not mean that I want to discourage excellent sites like this nor do I oppose the logical investigation
of (possible) planetary influences upon solar activity.
Our biggest problem is that we do not know the actual mechanism that is responsible for the observed correlation between planetary position and solar activity. I think that we are all convinced that there must be a connection. However, we must admit our limitations if we are to move this issue forward in the scientific community.
Hi Ian.
I have uploaded your graph and it should now be viewable via this direct URL to the image here:

I think this plot illustrates what is happening remarkably well, and look forward to further discussion here.
BTW, I am fully aware that the mainstream likes to have it’s mechanisms pinned down, but if you ask any of them about gravity, while they will quite happily point to their sophisticated mathematical models, they cannot describe any mechanism beyond the observed correlation between heavy objects (masses) and an apparent preferred direction of operation of an otherwise unknown force that seems to operate at a distance.
Thanks to Carl for posting the link, i’ve been away for 2 days.
And thanks to Ian for joining our debate, Your paper offers another solid theory inline with this blog and I would be very happy to share it with the readers of this blog if you so desire.
Your paper clearly shows the inferior and superior conjunctions of J+V+E, where as Hung & Jean-Pierre Desmoulins are not quite so forthcoming. I have plotted the peaks on Desmoulins graph, and like Ulric suggests it seems to line up with 2 sysygies. First phase is J+E+V, second phase is J+V with E apposed, but your alignments certainly throw another option in the ring.
I think Carls SSB graphs shows a clear and distinct pattern, and perhaps answers some of your queries suggested in your paper ie. the MWP and the present and how they don’t follow the theory. I wonder if the Oort minimum goes out of phase with the other minima as the N+U alignment shifts (1001), then goes through a period of poor line ups giving rise to the MWP. After that, the optimal period begins and continues to now but perhaps is weakening…maybe the current window of alignment will not produce minima as strong as we have experienced in the last 300 yrs? Perhaps there are 2 cycles, 1 keeping the Sun in an even beat and the other much less frequent cycle causing grand minima. Your suggestion that poor tidal J +V alignments during past minima is extremely interesting and offers another possible solution. I could do a separate post on the topic and open it up for debate if you wish.
But one aspect of this discussion wont go away for me, if we are going to consider planetary involvement, can we limit it to those planets inside Jupiter? In Desmoulin’s and Hung’s graphs the sunspot peaks drift away from JEV sysygies around 1790 and now (Hung doesnt go back as far), which seems to show a Neptune/ Uranus effect that needs to be factored in?
ps..agree with Carl, if a pattern emerges and is consistent and can be used to forecast, lets not worry about the cause…that will come.
Ian Wilson has very kindly given me permission to upload his latest paper, so it is now available here:
Click to access Syzygy.pdf
Discussion of these most interesting findings of Ian’s recent work can now get underway – perhaps Geoff might like to start a new thread for this?
Sounds good Carl….Ian’s work is indeed interesting and is just the sort of work relevant to this blog. Should have something up later tonight.
I have been looking for a calculation of how large force would be required to push the sun in and out of it’s average orbit around the center of the galaxy. I have found numbers like solar mass, mass of the galaxy (not the portion inside SSB orbit though), velocity through space and some formulas but have not been able to put it all together. Help from the brilliant minds in here would be much appreciated. The interesting part is of course to compare that to the gravitational force from the planets.
While I have nothing to contribute on the electromagnetic interactions of the planets, e.g, Venus and the Giant planets with the Solar dynamo, one can verify easily the importance of the Uranus/Neptune alignment using an orrey like that at the fourmilab site.
My only observation is that reviewing the prior temperature minima with the approaches of Saturn and Jupiter while U/N were proximal one sees that if Saturn nears the outer two with Jupiter closing a tight alignment results in a deep minima as measured by global temperature response. If, one the otherhand, Jupiter passes before Saturn approaches or after Saturn has outrun the outer two, a less impressive minima occurs.
Unfortunately, this does not permit-in my hands at least-looking at that alignment with respect to the galactic center per Jobe.
“I think that we are all convinced that there must be a connection. However, we must admit our limitations if we are to move this issue forward in the scientific community.”
Thank you for your leadership in this regard.
Great observation Gary and the quality of the Jupiter/Saturn position determines whether we get all 3 phases in a grand minimum (Sporer, Maunder) of 2 phases (Dalton) or 1 phase like we are about to get.
I have just extended Carl’s SSB graph to 900AD and I am amazed to see the past 700 yrs is not a common occurrence. The favorable Jupiter/Saturn position is indeed quite rare…..so much more work to do.
I’ve returned a number of times to review Ian’s article above I am a little sensitive to the use of ‘planet alignments’. Landscheidt clearly believed the issue was the change in momentum, around the second derivative zeroes. Ulric has added the magnetic field interactions of Sun and planets, with respect to earth, into that bargain, which clearly depend on the alignments.
I don’t mean to detract as I have followed Ian’s work since the CAM paper (I come from a telecoms background). Clearly he has explicitly stated the principle in places, like the third paragraph. This is just a modest suggestion of improvement.
Some one somewhere wrote (in a non-peer reviewed paper) using the analogy of a cup of liquid being jiggled and the resultant slosh the effect. This may be what Landscheidt had in mind, but he wasn’t specific. I think he was too careful to speculate rashly.
I still think it’s possible Tsagas(2006) may hold the key to the SS source via a relativistic effect of the Lorentz force. Magnetic fields resist deformation in a changing gravitational field at right angles to the plane of deformation. This would create currents in the plasma whose paths are gravitationally accelerated and, in turn, magnetic fields if new cells resulted at the polar margins.
Low rates of change in angular momentum yield little slosh.
I think this is a great piece of work. You have a clear general trend/basis on which to fine tune. The heliocentric planet plots/rings are a little small to read even when enlarged/clicked. Explanation is easy on the reader. Thank-you
With regard to the Sunspot Activity and Carbon 14 graph, what are you trying to show? The Carbon 14 data is off by fifty years compared to the Sunspot data. Are you saying that Carbon 14 temperatures lag Sunspots by fifty years? What could possibly be the mechanism for storing sunspot effects for fifty years and that would later affect Earth temperatures?
REPLY: I am not quite sure of your logic David, there is a lag in the production of carbon 14 that is accounted for in most 14C graphs. Could you explain how you see the 14C data is off by 50 years compared with sunspot data?
“The Carbon 14 data is off by fifty years compared to the Sunspot data.”
The 14C is produced from Nitrogen high in stratosphere near the poles, peaking near Solar minima.
The peak in life forms follows by 50 years, where’s the problem?
Examination of the coldest winters on the Central England Temperature series, including those in the Maunder and Dalton minimums, reveals that later in each of these years, average monthly temperatures regularly reach above average, and often high or near record levels, Very few years stay at depressed temperature levels all year long. This long record clearly shows that what we regard as climatic change, is composed of a string of 1-3 month +ve and -ve temperature features. Sometimes more -ve than +ve, as in the LIA, and sometimes more +ve than -ve, as in recent decades, and in the MWP. These features obviously also range in intensity. At what time of year that they fall is critical to not only yearly average temperature, but also to flood and drought cycles, because of the inverse relationship between temperature and precipitation at summer or winter months. So a grand minimum is a period when, a) frequent and strong enough -ve temperature events occur, caused by a range of extremes of heliocentric planetary configurations, and b) that these occur in N.H. winter months, where they can reduce temperatures by twice as much as would in summer months.
Beyond this, oceanic heat accumulation and loss needs to be considered and factored in.
I’m surprised there has (so far) been no mention of the following articles, which are highly relevant to the central theme of this discussion:
Charvátová, I., 1990a The relations between solar motion and solar variability, Bull. Astr. Inst. Czech., 41, 56-59.
http://adsabs.harvard.edu/abs/1990BAICz..41…56C
(Note that the pdf is available – free.)
Charvátová, I., 1988 The solar motion and the variability of solar activity, Adv. Space Res., 8, 7, 147-150.
Very interesting discussion – thank you to all.
[WORDPRESS HASHCASH] The poster sent us ‘0 which is not a hashcash value.
Hi, this interesting reference suggests there was no ‘phase catastrophe’ during the Dalton gap, just a very small, weak cycle and very, very few observations…
Click to access ESA_SP477_lostcycle.pdf
Um, I must admit I watch the #23/#24 deep Minimum’s progress with some fascination.
http://www.solarcycle24.com/
and…
http://www.spaceweather.com/
Nik
Point here is that it appears that Uranus and Neptune have magnetic poles that at times point towards each other and the Sun… result is at times a catastrophic event will result. When the Solar Wind died in 1999 it appeared that the Earth’s North pole was linked to the Sun and the South Pole was link somewhere in the outer planets…
On June 30, 1908 the inner planets were aligned in the same pattern as the Great Pyramids of Giza(just an observation not not implying there is a connection). Uranus and Neptune were also aligned on opposites sides of the Sun.
A similar alignment occured in early August 9909 BC ..this time including Mars … Neptune and Uranus were on opposit sides of the Sun. Jupiter Saturn were aligned in a cross like configuration with Neptune Uranus and Sun.. very similar to Tunguska alignment. The ingredients were all there.
Another candidate that correlates well with an extinction event approximately 12900 years ago also occurred in early August 12970 years ago. This featured Mercury, Venus, and Earth aligned on the Neptune side… very similiar to Tunguska in many respects.
The magnetic poles of both planets are highly tilted. Uranus pointing almost directly at the Sun on its rotational axis has an erractic magnetic field that at times points directly at the Sun. Neptune with a rotational tilt of about 30 degrees and the magnetic poles aligned 47 degrees off that; however, to the best of my knowledge, the poles rotate and do at times point at the Sun.
There is a reason the ancients associated planetary alignments with catastrohic events.
When someone shows me how to attach jpgs I will do so.
Quote from Uranus, Neptune, and Pluto and how to Observe Them by Richard Schumde, Jr.
“Like Uranus, Neptune’s magnetic field is not aligned with its rotation axis. … instead of polar ones; furthermore, they often point near the Sun. …”
This is a .mov file and I had to download it to play it. It shows how Uranus Poles move around and at time point at the Sun (or the Earth). Uranus’ North Pole points inward. Neptune’s South Pole points inward.
http://www.planetary.org/explore/topics/….ld_art_1990.mov
Voyager Neptune Science Summary
December 20, 1989
Courtesy of: NASA/JPL
Formatted to HTML by Calvin J. Hamilton.
http://www.solarviews.com/eng/vgrnep.htm
“Because Neptune’s magnetic field is so highly tilted, and the timing of the encounter was such that the south magnetic pole was very nearly pointed at the Sun, Voyager 2 flew into the southern cusp of the magnetosphere, providing scientists a unique opportunity to observe this region of a gigantic magnetic field. ”
Kimberlite formation was something I expected based on my theory. I checked for diamond mines and there is on near the location of the Tunguska Event. Mirny Airport (location of the mine) is known as Tunguska Airport.
http://en.wikipedia.org/wiki/Kimberlite
Kimberlite is similiar to a massive fulgurite imo and are caused by Tunguska like impacts.
http://en.wikipedia.org/wiki/Krasnoyarsk_Krai
This is a work in progress, and subject to correction and revision.
What, if any, effect does declination of the planets involved in the conjunction(s), opposition(s), or quincunx(s)?
REPLY: There are some working on this and there is a couple of theories flying around. In the relation to declination according to the Sun’s equator or the solar system barycenter there are some who think the the core is acting link a piston pump with the above and below force coming from the big 4. Also there is the north/south asymmetry where more sunspots can be seen in a certain hemisphere like we see in the north today (only Saturn is below the equator right now) and who knows the same situation could have a contribution or be the driver of the 11 yr cycle itself. I have been looking at that recently and noticing a 6 year pattern and trying to match it up with the Doppler patterns which are about 16 years long in total. If the 6 yr pattern was happening at the Tachocline and then fanning out to form the 16 year pattern (the last 11 yrs is used by sunspots) 2 years later it may be possible and the overlapping ‘V’ patterns would accommodate this, but I am not sure the dates line up just yet….what ever the outcome I think solving the origin of the “V’ pattern will go a long way to solving the 11 year solar cycle mystery.
It is interesting to note on the latest Doppler image that cycle 23 may have lots more years left in it….there is a whole lot more ‘V’ to work with yet.
The conjunction/opposition of Jupiter/Saturn are the main drivers of angular momentum.
Interesting read.
I have done some work on mapping solar activity to climate, which can be found here: http://www.netweather.tv/forum/topic/51548-climate-modeling-using-a-leaky-integrator/page__view__findpost__p__1518301
Others, on the same website, have been linking planetary activity to climate, with some success, for a while now, too. Perhaps planetary effects on sun activity is the missing link?
this website should be like wikipedia in the sense where you have a little index so you can read what you want to read and don’t need to read everything else to get to the part you want. you could also see if it is there. all i want to know is what the gravity is like on neptune. i’m not going to read all that for this.
I’m glad to find a very interesting site that possesses what now appears in 2010 to be significant insight into what is
coming down the solar pike. The Landscheidt minimum now occurring looks like it is going to be deeper than
the Dalton minimum. Will the sunspots may wink out in 2015? Interesting times. Must wait a few years now
for SC24 to peak around 2015.
Your website is great. It has substance. I came across it today. There is an obvious link between the slop of the Sun’s liquid – momentum – and solar output. I look forward to carefully reading your work. I follow a similar path.
http://blackholeformulas.com/files/gravity.html
Keep up the good work.
john.erich.ebner
schwabbe triplets = one phase of AMO / global temp indicator
—————————————————————————————-
CYCLE TRIPLETS
12 , 13, 14 (Even odd even) = cool AMO ( Even dominant..JEV align)
15, 16,17 ( odd, even , odd) = warm AMO ( odd dominant.. J + V with E opposing)
18,19,20 ( even, odd, even) = cool AMO ( even dominant)
21,22, 23 ( odd,even,odd) = warm AMO ( odd dominant)
24,25,26 ( even,odd, even) = cold AMO ( global temp cooling trend)
Something about the alignments you have specified that correlates with the Quasi AMO 60 yr earth climate cycle
The shifts occur as a see saw between these 2 configurations .? some sort of switch ( inflection point involved) at specific point at the end of each triplet. some sort of tipping point in momentum?
instantaneous effect on global temperature with NO LAG
For some reason the even dominant triplet cools the global temp whilst ‘in play’
I accidentally came across this blog while searching for some research on solar cycles prediction – and I’m really astonished… in 2008 (!) you exactly predicted the magnitude of SC24 peaking at the end of 2014, and its double-peaked shape too!
Now I’m waiting for the next minimum around 2019 and for a similarly weak SC25, and I am pretty sure that it will look exactly like in your graph.
Great work, really!
REPLY: Thanks Mo, 2008 does seem like eons ago, but everything on track as predicted. Watch the solar pole strength from now to see what SC25 will do. I suspect one pole will be neutral, which will upset the Dynamo.
Pingback: Hudson Bay Ice Anomaly & Winter Storm Front 73 F Temperature Drop (579) | Weather Forecast
Ulric Lyons, please contact me re. your solar/planetary observations at cap@electroverse.net (or can the moderator of these replies please send him my way).
Thank you,
Cap