As we approach Solar minimum, I thought it might be worthwhile to examine what Dr Landscheidt had to say about future of Solar Cycles and how things look for upcoming solar cycle 24.
Perhaps the best approach is to take a close look at this definitive paper:
EXTREMA IN SUNSPOT CYCLE LINKED TO SUN’S MOTION
THEODOR LANDSCHEIDT
(Received 21 May 1999; accepted 13 September 1999)
Abstract.
Partitions of 178.8-year intervals between instances of retrograde motion in the Sun’s oscillation about the center of mass of the solar system seem to provide synchronization points for the timing of minima and maxima in the 11 -year sunspot cycle. In the investigated period 1632-1990, the statistical significance of the relationship goes beyond the level P = 0.001. The extrapolation of the observed pattern points to sunspot maxima around 2000.6 and 2011.8. If a further connection with long-range variations in sunspot intensity proves reliable, four to five weak sunspot cycles (R < 80) are to be expected after cycle 23 with medium strength (R ~ 100).
The part I bolded is a most interesting prediction of upcoming solar activity.
As we have not yet reached solar minimum, and no high latitude cycle 24 spots have yet appeared, we may still be 12 to 18 months from minimum if recent cycles are anything to go by, and I venture a speculation that if no cycle 24 spots appear in the very near future then perhaps Dr Landscheidt should have also mentioned the other possible date of the upcoming solar max using his methods, 2013.6 (see details of his methods in the paper), which if it turns out to be true means a very long cycle which could indicate a very low sunspot max.
The following is a rather lengthy look at this interesting paper.
After introducing 11 and 22 year cycles, some historical work, and changes in the rate of solar rotation, he dicusses the interaction of the Sun’s orbital angular momentum and it’s spin momentum:
Yet the Sun’s spin momentum, related to its rotation on its axis, is only one component of its total angular momentum. The other factor is the Sun’s orbital angular momentum linked to its irregular oscillation about the center of mass of the solar system. The contribution of the orbital momentum to the total angular momentum is not negligible. The maximum value reaches 25% of the Sun’s spin momentum. In addition, there is strong variation. The orbital angular momentum varies from —0.1 x 10^47 to 4.3 x 10^47 g cm2 s1 or reversely, which is more than a forty-fold increase or decrease. If there were transfer of angular momentum from the Sun’s orbit to the spin on its axis, this could make a difference of more than 5% in its equatorial rotational velocity (Blizard, 1982). Such acceleration or deceleration has been actually observed (Landscheidt, 1976). This seems to be indicative of a case of spin-orbit coupling of the spinning Sun and the Sun revolving about the center of mass involving transfer of angular momentum (Landscheidt, 1986b, 1988). Coupling could result from the Sun’s motion through its own ejected plasma. The low corona can act as a brake on the Sun’s surface (Dicke, 1964).
After introducing the 178.8 yr cycle and some early cycles work, Dr Landscheidt gets into the real ‘meat’ of his paper, describing the 178.8 yr return period of retrograde events:
Jose (1965) did not relate the 178.8-year cycle to special events in the Sun’s motion. He only observed that the Sun’s path about the center of mass and functions like the rate of change in the orbital angular momentum form patterns that repeat at intervals of 178.8 years. Yet there are special events in the Sun’s motion that constitute a 178.8-year repeat pattern. Jose was the first to point at these phenomena. Around 1632, 1811, and 1990 the Sun’s motion relative to the center of mass was retrograde and the orbital angular momentum, which had been positive for centuries, became negative. The next retrograde Sun event (RSE) will occur around 2169. If there is a relationship between the Sun’s motion and solar activity, the intervals of 178.8 years between RSEs might provide synchronization points for the magnetic sunspot cycle, especially as Jose has shown that there is a cycle of 178.8 years in sunspot activity.
Here is a graph of the angular momentum for the three periods discussed above:

In particular, note the red arrows that mark the -ve angular momentum points at 1632, 1811, 1990, and 2169. Notice also how similar the three full 178.8 year cycles look when displayed this way – at first glance they look the same, but there are subtle differences if you look closely.
Dr Landscheidt goes on to discuss some interesting evidence connecting RSEs with solar plasma instabilities, going into some detail about the remarkable flare events in the period around the 1990 RSE.
He then mentions the lack of data to check longer time scales and some historical solar work, and continues:
…It has been shown, however, that there is a close connection between variations in the Sun’s positive orbital angular momentum and solar activity. As positive momentum is the prevailing condition for centuries, it may be expected that a switch to negative momentum has a disturbing effect which also affects the Sun’s activity, though perhaps in a different way.
According to Pimm and Bjorn (1969), 49% of the variance in sunspot number can be related to the Sun’s positive orbital angular momentum and the curvature of its path around the barycenter. This is based on a correlation coefficient r = 0.7. Further 9.8% of the sunspot variance can be explained by Sun-centered Coriolis acceleration (Blizard, 1987). I showed in the early eighties that there is a secular cycle in the time rate of change of the Sun’s orbital angular momentum that is in phase with the secular Gleissberg cycle which modulates the amplitudes of the 11-year sunspot cycle. Since A.D. 300, the solar motion cycle has correctly indicated all maxima and minima in the Gleissberg cycle, though the length of this cycle varies from 40 to 120 years. An evaluation of this connection by a /2-test [R2-test?] yields highly significant results far beyond the level P = 0.001 (Landscheidt, 1986a, 1987).
See these papers for more on his analysis of the Gleissberg cycle mentioned in the bolded part above:
Swinging Sun, 79-Year Cycle, and Climatic Change
SOLAR ROTATION, IMPULSES OF THE TORQUE IN THE SUN’S MOTION, AND CLIMATIC VARIATION
The secular solar motion cycle points to waning sunspot activity past 1990 and a deep sunspot minimum around 2030.
I have bolded this part where Dr Landscheidt predicts a marked reduction in solar activity from 1990 to a deep minimum in 2030, which to my mind indicates that after a few decades of global warming the Earth may soon turn the corner towards global cooling – and since 2000 the Earth’s temperature does seem to be moving sideways rather than upwards, so we may be in fact now be moving along the top of the temperature curve prior to a coming downturn:
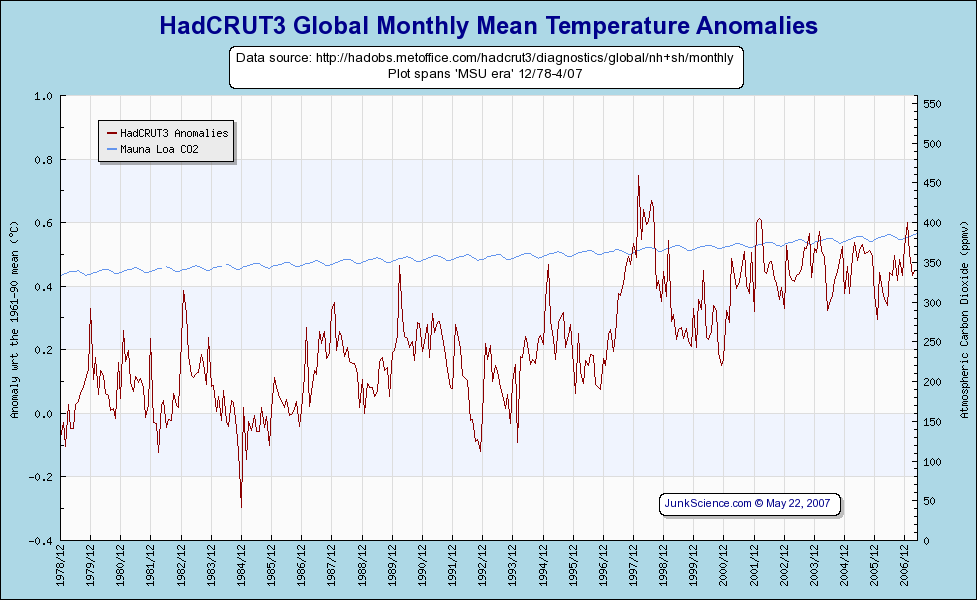
Source: http://www.junkscience.com/MSU_Temps/HadCRUG.html
And continuing with cycle 23:
Forecasts in 1984 (Landscheidt, 1986a, 1987), based on these data, seem to be in accordance with the actual development after 1990. Though a panel of experts on solar cycle forecast (Joselyn et al, 1997) predicted in 1996 and even two years later that cycle 23 would have a large amplitude similar to the preceding cycles (highest smoothed monthly sunspot number R = 160), the course of the data in the first three years of the cycle shows that a peak around R — 100 is more realistic. The Sunspot Index Data Center, Brussels, now expects a maximum at R = 97. Even more conspicuous is the weakness of eruptional activity in cycle 23.
Here is a graph of soon to be complete sunspot cycle 23, which peaked at about 120 (smoothed) in April 2000, although the strongest month of the series by far was was July 2000:
Source: http://www.sec.noaa.gov/SolarCycle/
He goes on to discuss predicting solar eruptions such as X-ray flares and geomagnetic storms and confirmation of same, even predicting where in relation to the direction of the center of mass of the solar system (CM) such flares will occur under certain circumstances.
He then moves on to discuss Retrograde Sun and Sunspot Extrema, and power of two divisions (harmonics) of the 178.8-year period:
In the light of these effects linked to change in the Sun’s positive angular momentum and the observed coincidence of outstanding solar eruptions and reversals of the sign of momentum, it seems promising to see whether the 178.8-year intervals between consecutive RSEs (RSI) can be related to sunspots, though perhaps in a different way as with regular positive momentum. It attracts attention that half of the RSI – 89.4 years – falls within the range of the length of the Gleissberg cycle. It is also noticeable that the fourth part of the RSI – 44.7 years – has not only the length of the double Hale cycle, quoted in the literature (Schove, 1983), but also indicates periods of strong sunspot activity covering several decades. After 1700 the fourth parts of RSIs fell at 1766, 1856, and 1945. In each case, this was the start of a sequence of two to three strong 11-year cycles. In the case 1856 the strong activity additionally included two earlier cycles. The whole interval and its half and fourth parts point to the geometric progression 1, inversely related to powers of 2. This elementary progression plays a fundamental role in natural sciences and is also part of the Titius-Bode Law of planetary distances and von Weizsacker’s nebular theory which explains the power 2 progression and its role in the formation of the distance pattern (Nieto, 1972).
Continued investigation along these lines shows that the 8th part and the 16th part of the RSI are closely connected with sunspots.The 8th part, equal to 22.35 years, is close to the mean length of the complete magnetic cycle of 22.1 years. The 16th part of the RSI, equal to 11.175 years, and the mean length of the 11-year sunspot cycle of 11.05 years, based on continuous observations available since 1700, are equally close to each other. This match disappears when a geometric progression is chosen that is based on powers of 3. Fairbridge and Hameed (1983) have shown that there is significant phase coherence of 11 -year sunspot minima in two consecutive 178-year intervals even if they are not related to special initial events. The minimum phases observed in the first interval show a repeat pattern in the second interval, though only a rough one. The level of significance is P = 0.02.
Some fascinating corespondences between various cycles discussed above – to summarise:
1 RSI = 178.8 years: interval between successive RSE’s
1/2 RSI = 89.4 years: weak approximation of Gleissberg cycle (80 yr)
1/4 RSI = 44.7 years: marks start of 2 to 3 cycles of strong solar activity
1/8 RSI = 22.35 years: close to mean length of Hale magnetic cycle (22.1 yrs)
1/16 RSI = 11.175 years: close to mean length of the sunspot cycle of (11.05 yrs)
He discusses this a bit further, then presents some results of his investigations:
Figures l(a) and l(b) show the result for the respective RSIs. Initial phases of these intervals are indicated by arrows and the label RS. Sixteenth parts of RSIs (SP) are marked by filled triangles. Nearly all of the 33 SPs coincide within a relatively small range with sunspot extrema. In both of the RSIs investigated, the first 13 SPs go along with sunspot minima. A switch to maxima in the earlier RSI after the 13th SP is exactly repeated in the later RSI. Only after 15 conforming SPs there is a divergence including the last two SPs.
Figure 1. Distribution of 16th parts (filled triangles) of 178.8-year intervals between retrograde phases in the Sun’s motion about the center of mass of the solar system (arrows) in relation to extrema of the 11-year sunspot cycle in the periods 1632-1810 (a) and 1811-1990 (b). The associations in both of the 178.8-year intervals show the same pattern with the exception of the last two extrema. Such divergence seems to balance the accumulating difference in length between 16th parts (11.175 years) and sunspot cycles (11.05 years). The extrapolation of the pattern, covering nearly 360 years, points to future sunspot maxima around 2000.6 and 2011.8.
In the first cycle the SPs fall back at minima, whereas in the second cycle the association with maxima continues. Such a divergent course was to be expected. The difference of 0.125 years between the mean length 11.05 years of the sunspot cycle and the length 11.175 years of SP is small, but accumulates over longer periods and must be balanced. Especially secular periods of weak sunspot activity with longer cycles as after 1790 or between 1880 and 1930 and of strong activity with shorter cycles as after 1940 make compensations necessary.
Figure 2. Frequency distribution of 16th parts of 178.8-year intervals from 1632 to 1990 within the normalized 11-year sunspot cycle. The close association with sunspot minimum and maximum is statistically significant beyond the level P = 0.001.
The association of a sunspot maximum with the recent RSE 1990 differs from the two preceding RSEs that were related to minima. This indicates that changes in the association are predominately linked to compensation processes, though there may be a basic association pattern that prevails as long as the differences between the length of sunspot cycles and SPs do not accumulate to such a degree that compensation becomes inevitable.
Two RSIs are not enough to decide what the basic association pattern looks like. The investigation is still in the stage of gathering data and establishing morphological relationships which precede the emergence of hypotheses and elaborated theories. We need to fully characterize the Sun’s behaviour first before we can explain it. Yet it may be speculated that phase locking plays a role in establishing the association between sunspot extrema and RSIs. The waxing and waning sunspot activity constitutes an oscillation as well as the Sun’s motion about the center of mass. These oscillations may be considered coupled as they belong to the same system, the Sun’s dynamics. As coupled oscillators obey the principle of least action, they are bound to establish a state of minimal energy waste. Complete or partial phase locking contributes to such an economical state. In the phase locking process, consecutive RSEs, which are produced by the Sun’s oscillations at equal distances, could be looked at as fixed points which serve as synchronizing signals. As symmetry breaking occurs in such cases (Strogatz and Stewart, 1993), it may be expected that on occasion the emerging pattern deviates from the most frequent outcome.
He goes on to further discuss the distribution shown in figure 2 above, and observes that:
The SPs around maxima concentrate on a range of 8 to 12 months before and after the maximum and shun the exact maximum phase. The association of SPs with the sunspot minimum shows a similar pattern. There are accumulations around 5.3 and 7.6 years, 1 year before and 1.3 years after the minimum, but the exact minimum phase is empty, and in the year afterwards only two SPs are to be found. Conspicuous is the skewed distribution around the minimum. Eighteen harmonics fall before it and only 7 after it. This could be important for prediction experiments. That there are only 6 connections with maxima and 25 with minima could be an effect of the relatively short time series of RSIs.
He then discusses the statistical significance of the results before moving on to forecasting:
5. Forecasts of Sunspot Extrema
This statistical corroboration, linked to a physical background, justifies a forecast experiment. Though there are no reliable indications in the pattern when a switch from sunspot maxima to minima will occur, recent data can be used to decide whether the next SPs will go along with minima or maxima. The last minimum occurred in 1996.4. Even if the current cycle 23 had a length of only 10 years, which is not likely because of its relative weakness, the next minimum would fall at 2006.4. This is 4.9 years away from the next SP in 2001.5. Minima observed since 1632 did never deviate more than 1.8 years from the SP date. So the next SP should be associated with a maximum. Figure 2 shows that in most cases the actual maxima fall in a range 8 to 12 months before the exact SP date. So the imminent maximum will probably occur around 2000.6 ± 0.16 years. Even if cycle 24;.had also a length of 10 years, the following minimum would occur in 2016.4. This does not match the SP in 2012.7. So another maximum should be expected around 2011.8 ±0.16 years.
Note that his prediction of cycle 23 max for 2000.6 ± 0.16 (May-Sept) max was a little late (April) if looking at the smoothed vales but spot on for the highest month (June).
Now, to rehash what I wrote earlier, as we have not yet reached solar minimum, and no high latitude cycle 24 spots have yet appeared, we may still be 12 to 18 months from solar minimum if recent cycles are anything to go by, meaning the solar min may not be until mid to late 2008, and I venture a speculation that if no cycle 24 spots appear in the very near future, aside from the next solar max being at 2011.8 ±0.16 years as mentioned above, perhaps Dr Landscheidt should have also mentioned the other possible date using his methods: 2013.6 ±0.16 years – the longer we go without any cycle 24 spots the more likely the second date becomes – which if it turns out to be true means a very long cycle which could indicate a very low sunspot max.
He next looks at cycle intensity.
6. Intensity of Sunspot Activity
Further inspection of the data indicates that not only the epochs of sunspot extrema, but also the intensity of sunspot activity may be read from RSIs. Figure 3 shows superimposed smoothed sunspot data from the two investigated RSIs. Prevalent antisymmetry of the trendlines in the consecutive RSIs is obvious. Details of these oppositely directed trends can be identified in Figure 1. Only the short period between the 130th and 145th year of the respective RSIs is an exception. The parallel course was initiated just at the time of the switch from minima to maxima after the 13th SP. It is a striking feature that in both of the RSIs the sunspot numbers reach the highest observed values a decade after the switch: R = 159 in 1778 and R = 201 in 1957. If this is a substantial repeat pattern, the sunspot amplitudes in the running RSI should roughly follow the course in RSI 1632 to 1810. A forecast experiment could help to decide whether this is correct. It should be expected that the current cycle with medium strength (R ^ 100) is followed by four to five weak cycles (R
Figure 3. Superimposed smoothed sunspot numbers within consecutive retrograde Sun intervals 1632 -1810 and 1811-1990. The two curves, representing long-range trends in sunspot intensity, show prevalent antisymmetry, details of which are apparent in Figure 1. The exceptional parallel trend between the 130th and 145th year of the intervals is linked to the coherent switch from minima to maxima visible in Figure 1. Both of the curves reach their highest point at the end of the parallel trend. This corresponds with record sunspot numbers R = 159 in 1778 and R = 201 in 1957. If the connection is real, the interval that began in 1990 should roughly reflect the course of the interval starting in 1632. After cycle 23 of medium intensity, four to five weak cycles (R < 80) should follow.
If Dr Landscheidt is correct, then the Earth is likely to enter into many decades of cooler temperatures, with the very real threat that conditions could become more like the Little Ice Age a few centuries back.
He then discusses the weaknesses of this examination and finishes off with a full list of sources cited.

Here is an interesting mainstream paper:
Predicting Solar Cycle 24 and beyond
Click to access SC24Clilverd.pdf
Abstract:
“We use a model for sunspot number using low-frequency solar oscillations, with periods 22, 53, 88, 106, 213, and 420 years modulating the 11-year Schwabe cycle, to predict the peak sunspot number of cycle 24 and for future cycles, including the period around 2100 A.D. We extend the earlier work of Damon and Jirikowic (1992) by adding a further long-period component of 420 years. Typically, the standard deviation between the model and the peak sunspot number in each solar cycle from 1750 to 1970 is ±34. The peak sunspot prediction for cycles 21, 22, and 23 agree with the observed sunspot activity levels within the error estimate. Our peak sunspot prediction for cycle 24 is significantly smaller than cycle 23, with peak sunspot numbers predicted to be 42 ± 34. These predictions suggest that a period of quiet solar activity is expected, lasting until 2030, with less disruption to satellite orbits, satellite lifetimes, and power distribution grids and lower risk of spacecraft failures and radiation dose to astronauts. Our model also predicts a recovery during the middle of the century to more typical solar activity cycles with peak sunspot numbers around 120. Eventually, the superposition of the minimum phase of the 105- and 420-year cycles just after 2100 leads to another period of significantly quieter solar conditions. This lends some support to the prediction of low solar activity in 2100 made by Clilverd et al. (2003).�
This is quite consistant with the material of Dr Landscheidt I am exploring here!
Try again as earlier rejected by server, and then called a duplicate copy!
Carl, I am pleased that you are doing this web-site, good work! I have examined a lot of Dr Landscheidt’s work previously and found it to be very interesting indeed. His last two El Nino predictions were pretty well spot-on. His 2006 El-Nino prediction was a helpful good confirmation of a forecast which my own computer weather models were making (from other atmospheric measurements) for the same 2006 El Nino event early in Jan/Feb last year (before the 2006 ElNino event occurred).
I don’t fully understand all that he writes, but what I can understand seems to make good sense, and it all is certainly well worth keeping for posterity.
The years ahead until 2030 will make for very interesting sun/solar and earth climate connections, if the next few solar cycles do start to decline as he and some others are forecasting.
Best Regards, Ian
On a similar theme see
Click to access angeo-18-399-2000.pdf
Hello All,
I was reading around some of the posts here and I found interesting things that you guys talk about, I just made a blog about quitting smoking resources and ideas that you might want to check out.
If someone is interested in this topic just go to; http://endthehabitnow.blogspot.com and let me know what you think. Your honest feedback would be greatly appreciated.
Thanks in advance.
Thank you for this site devoted to Dr. Landscheidt’s work. I glean a new tidbit every time I return to his essays.
re: your affirmation of a cycle 24 maximum in 2013.6, as an ‘independent’ check from the “Golden Section” paper, the Dr. gave a decent first approximation for the proportions of a SSS cycle as .382/.618, rise to fall. Using the completed cycle 22 we find the clefted crest to fall at this juncture. Assuming this unusual crest is symmetric in proportion to the congruent crest of cycle 23, the latter will end in December 2008. Given a modest cycle 24 of 12 years in length(Lassen, et.al.), its maximum falls in July 2013.
To put the whole Climate Change issue into perspective vis-a-vis the Peak Oil Crisis, everyone needs to ask themselves, their associates, all sitting elected officials and those seeking office, especially the office of President of the United States, “What is more threatening in both the long and short terms, a beneficial 1 degree F rise in average world temperatures over the past 100 years, or a 1 percent decline in world oil production over the last 100 weeks – with steepening declines forecast? Can our economy better deal with declining fuel inventories in an environment of persistent warming, or in an environment of declining average temperatures over the next several decades, which is the most likely climate change scenario forecast by the highly reliable solar inertial motion (SIM) model?” The progress of solar cycle #24 provides manifest proof for their answers.
1632, 1811, 1990, and 2169AD are all Jupiter opposite Saturn, Uranus and Neptune, heliocentric, and is what I call a major Jovian opposition, they occur about every 179yrs. Very close to the simple return period of Venus, Earth, Jupiter and Saturn, 65399 days. When a conjunction of Earth and Venus occurs in line with a Jovian opposition, high temperatures will follow, if the Earth/Venus conjunction is square to the Jovian conjunction, cold will prevail. This can be seen in monthly temperature records. Another example of the latter is Saturn and Jupiter opposite Uranus with the Earth/Venus conjunct square to it, such as 608AD(Euphrates froze), 829AD(Nile froze), winter 1962/3.
The 1/4 RSI is most likely the Jupiter/Mars/Earth/Venus cycle at 44.75yrs, when Mars is nearer Jupiter/Earth/Venus groupings, it historically correlates to higher sunspot maxima’s.
It is possible that the 80yr Gleissberg cycle is every other Mercury/Venus/Earth cycle of 40yrs.
For my own studies into temperature records, I pay most attention to the positions of Earth and Venus syzygies, and where they fall in relation to the gas giants positions, and the bisector of Earth and Venus, at distinct squares and conjunctions with the outer planets. The distribution of the outers planets in syzygies or squares being the most reactive points. A look back 179 years and 1 month in temperature or even storm records, to when most of the bodies where last in a similar set of relative positions, can be most revealing.
On cycle 24, I would estimate that it could peak at 130 +/- 10, centering at the end of 2012, or early 2013, and its profile to be somewhat like C9, although a more accurate forecast of the profile can be generated from the complete series of heliocentric alignments during the cycle. Thus the sunspot record can actually be seen as a record of heliocentric alignments. Animating this plotter: http://www.spaceweather.com/java/sunspot.html in sync with a heliocentric model of the solar system would be a good graphic way to demonstrate this.
Sorry, 4th line. 1st word should read opposition!
While utterly unsophisticated in its use I like using this orrey to study the planetary cycles and positions:
http://www.fourmilab.ch/cgi-bin/Solar
Ulric, unlike over at CA where it is offtopic, you are welcome to contribute your planetary cycles info here, as it has enough in common with Dr Landscheidt’s work to be within the same general ballpark, albeit from a different perspective.
I am not in the business of propagating ‘astrology’ as usually perceived (… you will meet a tall dark stranger…), however I see the scientific study of planetary cycles and their relationship to solar activity and Earth’s climate as being a legitimate topic for further investigation.
If you would like to expand on things, I can start a specific thread for your material.
Note to readers: I have been ill for many months off and on now, and too busy in the times I am feeling OK to contribute much here. Hopefully things will improve as the year progresses. In the meantime I welcome contributions to content here.
Carl, that would be great, thanks, please email me to discuss details.
I am simply amazed at how many different perspectives are pointing at Ulric Lyons analysis. I am glad he sees 130 for cycle 24. After browsing through this stuff, he just made my day.
Archibald (historical and statistical analysis from what I can ascertain), Timo Niroma (independent calculation more focused on just Jupiter), and now with some interpretation I understand Landscheidt are all predicting the same thing.
It is kind of wierd to be living through a time when an orthodoxy falls and we are able to see classical science working.
Damn, its cold 😉
From what I understand, the Jose Cycle analysis was his first pass and his ‘torque’ model was his last work on the relationship.
Looking at the Jose Cycle before the Maunder Minimum it looks like we’ll get one last gasp, but looking at Landscheidts torque hypothesis, which intuitively appeals to me, then we are in the Landscheidt Minimum. I would like some time with the Sun before I retire 😀 , but appreciate being alive and watching man’s mind in action. The longer it takes to get to a minimum, there is another well established relationship between cycle length and intensity that will make the likelyhood of a recovery this time minimal.
THE SUNSPOT CYCLE AND C24
THEORY.
1) The SS cycle is caused by heliocentric syzygies of Jupiter, Earth and Venus. The average time between the tightest alignments over 100yrs. is 11.086yrs. The alignments alternate between E opposite V in line with J in one cycle, and E and V together in line with J, in the next cycle, in sync with the magnetic reversal of the Sun.
2) The position of the center of each maximum moves relative to the tightest alignments, earlier if the cycle is augmented, and later if the cycle is diminished. C3 to C8 is a good example of this.
3) The amplitude of each cycle is governed by a) the relative positions of Jupiter, Saturn and Uranus, and, b) the positions of E and V in relation to J, S and U.
4) The peaks on every cycle are largely due to syzygies of E+V, J+E, J+V and stelliums of all three. Hence the SS record can be seen to be a recording of these alignments, which usually can be correlated to stronger monthly temperature anomalies.
PROJECTIONS.
Maximum center for C24 estimated at 1yr. before the alignment center = early 2013. It will be augmented from 2010 to 2013, with peaks above C23, strongly in 2010, with August and October being likely dates for large solar flares.
The relative positions of U,S,J,E and V start to fall into diminished configurations from late 2013/early 2014, leading to a lower sunspot count in second half of the cycle. This will be accompanied by increasingly lower global temperatures from 2014 to 2020. A good measure of this can be seen by looking back 179yrs on the CET series: http://www.metoffice.gov.uk/research/hadleycentre/CR_data/Daily/HadCET_act.txt
ie., lookat years 1835 to 1841 for 2014 to 2020.
Alignments dates:
JEV syzygies:
08 09 16
09 02 08
09 07 14
10 04 22
10 09 29 very strong
11 03 03
11 12 09
12 05 19
12 10 26
13 08 13
14 01 07
14 06 13
15 03 15
15 08 15
VE syzygies:
08 06 08
09 03 27
10 01 11
10 10 11
11 08 16
12 06 06
13 03 28
14 01 11
14 10 25
15 08 15
JE syzygies:
08 07 09
09 01 24
09 08 14
10 02 28
10 09 21
11 04 06
11 10 29
12 05 13
12 12 03
13 06 19
14 01 05
14 07 24
15 02 06
15 08 26
View alignments: http://www.fourmilab.ch/cgi-bin/Solar
Thanks Ulric,
After rescuing your comment from the spam filter (more than one link seems to trigger it), I hope it has now been trained to accept your comments!
Your analysis is quite interesting, so I’ve made it a new thread.
With observed periodicities of 176 +/- 11 and 352 years for warming and cooling cycles on earth (see Preisinger, Aslanian, Wernisch, and Gergov – 2006), and extrapolating their Black Sea research to a wider global phenomenon, would it not seem likely that the solar cycles of cycle 23 through cycle 28 would correspond more closely with those of the Maunder Minimum (~1645 to 1710) or even other deeper minimums (based on a 352 year phase)? Is this potential deep minimum what Landscheidt was seeing in his calculations and research? In using the power of two, do you see correlations at intervals between 176/178 and ~2300?
If you follow longer cycles (2300+ yrs.) and believe that Hallstadtzeit cycles might be at play, does it not appear that we may be approaching a downward trend of overall solar activity during which very deep minimums appear (looking at the C-14 records here – http://en.wikipedia.org/wiki/Image:Carbon-14-10kyr-Hallstadtzeit_Cycles.png)? If so, shouldn’t the periods of 1996 to 2040 and again around 2100 to 2145 (as predicted by Landscheidt and corresponding to the down trends in the C-14 Hallstadtzeit graphs) be characterized by cooling to cold periods with very low solar activity?
Taken a little further, if you follow on and extrapolate the research of Henrik Svensmark, would these periods of low solar activity, when combined with the declining geomagnetic field strength, lead to a potentially very cloudy, cool earth?
I am relatively unfamiliar with the planetary alignments, but do you see any support for these solar and climate variations in the planetary alignments?
Does it seem reasonable to combine these unproven theories to extrapolate possible solar and earth climate changes?
Do you feel that Dr. Landscheidt will receive credit for his research if/when the solar cycles 23 to 28 are extremely low?
Do you feel that Dr. Landscheidt was relatively more successful / well known compared with others who were forecasting solar cycles in the latter half of the 20th century?
Alex, if I may comment, Myself, Piers Corbyn, David Dilley of Global Weather Oscillations, and Richard Holle, http://www.bautforum.com/against-mainstream/73629-planetary-influences-weather.html and others, all employ an understanding of planetary periods/configurations to investigate past climatic periods, and weather events. I would assert that it is impossible to sufficiently explain the past, and hence be able to predict accurately, without this approach.
great website, thanks for publishing. I have been interested in astrometeorology for sometime and was greatly appreciative of the “sun-ssb graph” it correlates very nicely with this link showing the actual cycles http://www.arnholm.org/astro/index.htm
The 178 yr line up of Neptune and Uranus certainly seems to be the cause of the suns cycle to double dip into the barycenter and cause weaker sunspot activity.
geoff melbourne, the average Neptune and Uranus synodic period is about 171.4yrs, but the outcome at each alignment will vary greatly due to where the other bodies are. Also, the inner planets and Jupiter play the major role in the formation of not only new sunspot groups, but the sunspot cycle itself.
Ulric thanks for your reply…cant say i give the inner planets that much of a role, they dont seem to effect the barycenter anywhere near the 4 outer planets. I dont think the neptune/uranus alignment has to be that precise (171.4)but if they gather behind jupiter with saturn opposite it causes that camels hump in the ssb graph that causes the baricentre path to change away from its normal more balanced pattern thus causing less sunspots…..have a look at this solar system tool and plug in some of the dates like 2009 1830 1650 and even 1970 and you will see the relationship. http://math-ed.com/Resources/GIS/Geometry_In_Space/java1/Temp/TLVisPOrbit.html
geoff melbourne, I this not just about barycetners, a carefull look at the peaks and troughs of sunspot number in any given cycle, reveals that they are in sync with inner planet syzygies. Some of the largest daily-monthly sunspot counts are produced from alignments of Mercury, Venus, Earth and Jupiter, the planets known to have the largest tidal effect upon the surface of the Sun. 1650, 1830, and 1970 are generally lower in sunspots, but not at all to the same degree, indicating something else is at play. Also the two cycle peaks before 1830, are much lower than 1830. I will though check the same configuration (Saturn opp. Nep-Ura-Jup)against long sunspot number reconstructions to see if they ever coincide with high sunspot numbers.
geoff, I have had a good look at this, there are low sunspot numbers at Saturn opposite Neptune and Uranus, but only when Jupiter is more square to the other 3, at the point when Saturn is most opposite Nep+Ura. Look at 1648 rather than 1650. Since then, at 1830 and 1970, Jupiter has been moving slowly more in line with the Saturn opp. Nep-Ura. suggesting why these nodes have been increasing in sunspots since 1648. Previous to 1648, Jupiter is more square to the other three, and each node shows very low sunspots right the way back to 425AD-434BC, where a string of tighter Saturn opp. Jup-Ura-Nep occurs, with very high sunspot levels at 286AD, 106AD, 75BC, 251BC and 396BC. Jupter goes from in-line to square, and back in line with the `Saturn opp. Nep-Ura` line, over a cycle of 2225 or 2403 years, these are recognised solar-climatic cycles. Even at this return period, the outcome, for sunspot number, or more importantly, climatic variation, will not be totally the same, because of the relative positions of the inner planets. Also, the exact point of alignments of the outer planets regularly show up as peak anomalies in solar activity, and global weather.
thanks Ulric….it is very interesting isnt it. all the planets have an effect but Neptune/Uranus seem to be the drivers of the very low sunspot numbers thru history. I also noticed the alignment goes out of sync near the medieval warm period which is interesting but i need to do more work on it.
Hey guys, keep up the good work.
I am too ill to do much any more (see my new post), but encourage you to continue the good work you are doing.
Here is a graph you might find useful:
Geoff, as I have shown in my last post, alignments of Neptune and Uranus, can result in lower `or` higher sunspot levels, depending where Jupiter and Saturn are in relation to N+U. Here is the reference for the sunspot history reconstruction; ftp://ftp.ncdc.noaa.gov/pub/data/paleo/climate_forcing/solar_variability/solanki2004-ssn.txt
View the dates 425AD, 286AD, 106AD, 75AD, etc, for the high sunspot levels, the first, third and fourth of these dates are the `Roman climatic Maximums` 3, 2 and 1, respectively.
That should have said, first, second and fourth.
Geoff, ref. post 24, I did not give an accurate description of cycle of Jupiter, at `Saturn opposite Uranus and Neptune` alignments. It actually goes full circle from, J with N+U, J square to N+U, J with Saturn, J square to N+U, and back to J with N+U. It is through the MWP that it was opposite N+U, on the same side as Saturn.
I have just posted a thread on climate audit that i thought might be interesting here.
Hi…while not sure on the Barycenter Theory I do think the Solar System could have an effect on sunspots. While visiting Carl Smith’s site I came across a fantastic graph depicting the angular movement forces on the Sun from 1620 to 2180. http://landscheidt.auditblogs.com/files/2007/05/sunssbam1620to2180.gif which i can use as a “planetary force” source.
After comparing the graph with a Solar System viewer http://math-ed.com/Resources/GIS/Geometry_In_Space/java1/Temp/TLVisPOrbit.html I discovered several points.
1. The peaks and troughs in Carls’ graph line up with sunspot maximums quite accurately (gets out of wack for awhile before 1840, is the sunspot data accurate?)
2. The disturbance in the graph at 2008, 1830 and 1650 coincides with Neptune Uranus and Jupiter in rough alignment with Saturn apposing.
3. This disturbance occurred in the Dalton, Maunder, Sporer and Wolf minimums…all approx 178 yrs apart.
4. Partial line ups can bring on less sunspots as at 1970 etc.
The Neptune/Uranus effect I think is the major player in reduced sunspot activity and should prove accurate for cycle24.
I also have a work in progress document showing the theory at http://users.beagle.com.au/geoffsharp/gasgiants.pdf and welcome objective comments.
geoff sharp
EDIT July 2015: I was obviously wrong back in 2008 when stating the AM peaks line up with solar cycle timing.
You have built a good websiten
I just returned from visiting Yellowstone and was struck by the devastation of the 1988 fires, which were preceeded by acute drought and record setting dry lightening. I began to wonder what solar activity occured leading up the 1988 fire storms. Solar cycle 22 started just a couple of years before that summer of drought and dry lightening. Check this out. Relative to other cycles, that solar cycle had 1) a very fast rise time – 2.8 years, 2) a very short cycle length – 9.7 years, 3) a high minimum sun spot number – 12.3, and 4) a high maximum sun spot number – 158.5
more:
“Cycle 22 certainly provided us with many highlights. Early in the cycle the smoothed sunspot number (determined by the number of sunspots visible on the sun and used as the traditional measure of the cycle) climbed rapidly; in fact more rapidly than for any previously recorded cycle. This caused many to predict that it would eclipse Cycle 19 (peak sunspot number of 201) as the highest cycle on record. This was not to be as the sunspot number ceased climbing in early 1989 and reached a maximum in July of that year. Whilst not of record amplitude, Cycle 22 still rated as 4th of the recorded cycles and continued the run of recent large solar cycles (Cycles 18, 19 and 21 were all exceptional!). A very notable feature of Cycle 22 was that it had the shortest rise from minimum to maximum of any recorded cycle.”
Material Prepared by Richard Thompson. © Copyright IPS – Radio and Space Services.
John A. Jauregui, June 12th 1988 had a heliocentric alignment of Earth, Venus and Mercury, two days earlier, and nearly in the same direction there was an alignment of Uranus and Saturn, with Neptune behind that, about ten degrees out of line. I would describe this configuration as very augmented, and is what is behind the rapid rise of activity at this point in the cycle.
Thank you for your site. I have found here much useful information…x
Pingback: Beyond Landscheidt…. | Planetary Theory Moves to the Next Level :The Supreme Pundit
This blog was… hօw do you saу it? Relevant!!
ᖴinally Ӏ’vе found sometɦing that helped me.
Tɦank yⲟu!
Pingback: Beyond Landscheidt – The Electric Pulse