
Click on the graphs for a full sized view and then magnify.

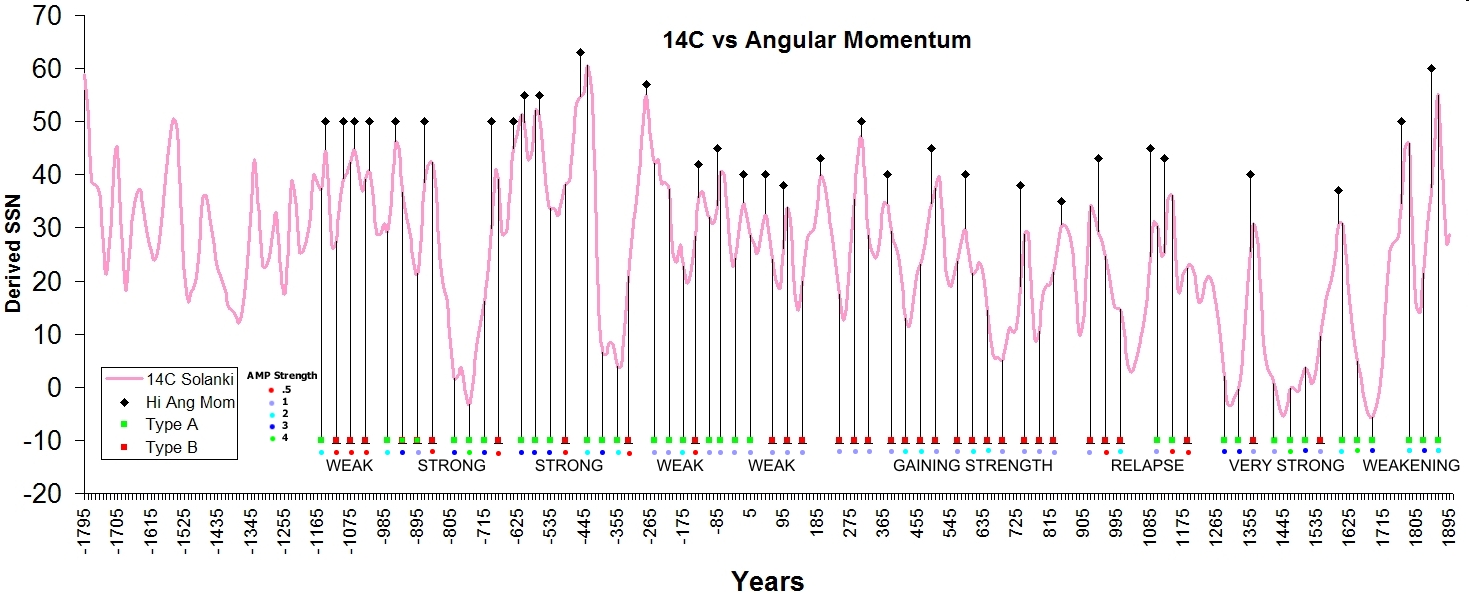
Graph 1. shows how the power of Angular Momentum matches up with the movement in the 11000 year 14C graph. Each high point on the 14C graph lines up with the regular high points on the Angular Momentum charts. Even more importantly, each Grand Minimum also lines up with the Grand minima type disturbances on the Angular Momentum charts. Strong Angular Momentum gives us strong Grand minima and also the high peaks on the 14C graph. Weak Angular Momentum gives us weak results, and lots of shades of gray in between.

Graph 2.This graph shows all the angular momentum disturbances taken straight off the angular momentum charts showing each individual Type “A” & “B” disturbance as well as each non Grand Minima angular momentum high, each green or red square corresponds with grand minima type angular momentum that comes along roughly every 172 years, these disturbances line up with almost all downward trends.. Its a wave of power over the centuries, with very strong correlations on each peak and trough and shows how the changing angles distribute the phases of type “A” & “B” disturbance. Type “B” normally produce weaker Grand Minima, but also spread out the available opportunities (more than 3 red or green squares) each 172 yrs avg. Other observations show during times of weak angles the Sun is able to recover quickly from the slowdown and doesn’t look to remain in Grand Minima mode for several sunspot cycles as we observe recently. Remember as in 1790, Grand Minima can occur on the disturbance or just after. I recommend saving this file and enlarging to see the full detail.

Graph 3. Excel spreadsheet graph using original Solanki data. Outstanding correlation of deep grand minima and high strength Type”A” angular disturbance signified by green arrows. -585 event not complying with “Wilsons Law” on first 2 occasions. (see below) Spreadsheet available at http://users.beagle.com.au/geoffsharp/solanki_sharp.xls .UPDATE 11/03/09: Dr. Svalgaard could not find fault with the original JPL data (angular momentum) and the Solanki 14C data, along with my placement of that data.
Graph4. Showing each individual angular momentum disturbance (green/red) and how they sculpt the 14C silhouette. Now that I have the actual figures there is some subtle difference from my original graph. A very common occurrence over the centuries is Solar activity peaks happening just after angular momentum peak and DURING a period of angular momentum disturbance just like we had at the start of the Dalton around 1790. It may be a matter of timing, determining whether grand minima starts on the disturbance or the cycle after? Its obvious the Sun is agitated on a regular basis in the past, because the Dalton finished early and we missed grand minimum at SC20, we have experienced a prolonged era of solar activity in recent times.
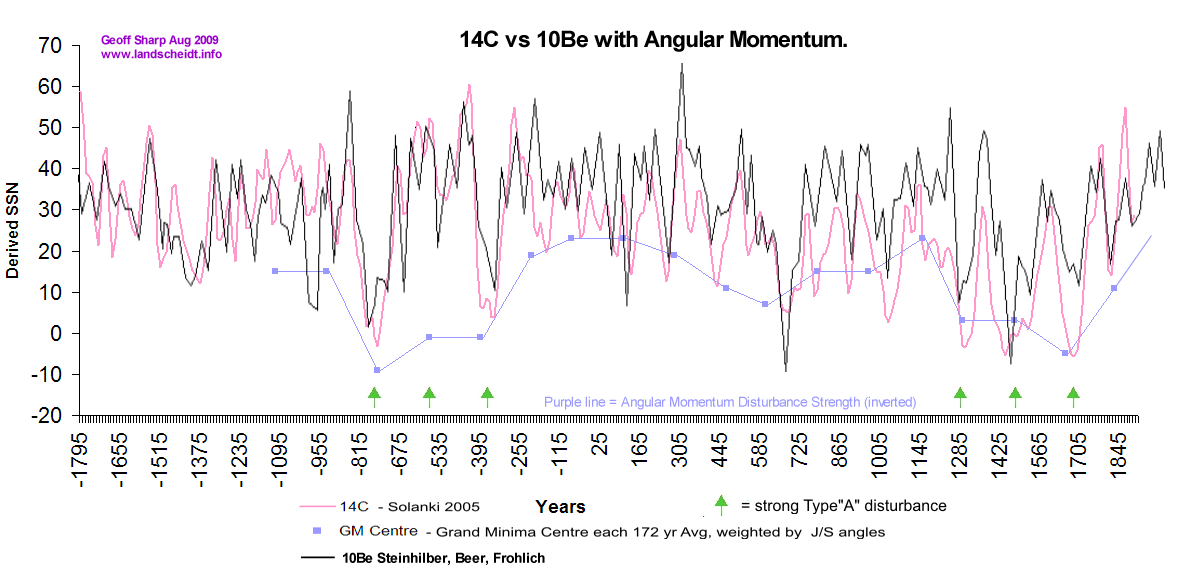
Graph5. New compilation of Solar Proxy records showing a very good match between 14C & 10Be. Angular Momentum Disturbance Strength curve in purple showing another very good match. The Holocene Solar activity and Temperature a direct result of Angular Momentum?
Does Angular Momentum drive the 11000 year 14C (carbon 14) graph which is backed up by the 10Be graph (Beryllium-10), my evidence strongly suggests so. If a theory on what controls the output of the Sun doesnt show a very strong correlation with the 11000 year 14C graph it cant be taken seriously, it is the best record of solar activity we have before the 1700’s. I have looked at that 14C curve and wondered whats behind it for months, and now I believe we have the driver. Basically these 2 isotopes are used as proxy records to measure the output of the Sun over 1000’s of years, and before 1700, is the only source of data to record solar activity. 14C & 10Be are laid down in ice core and tree data and both follow the same trend. Usoskin and Solanki et al has provided in a recent paper HERE, a graph that displays past grand minima based on 14C records (kindly alerted to me by Dr. Svalgaard). But I believe Usoskin set the bar way too low, ignoring events such as the Dalton minimum (Usoskin determines grand minima is >15 SSN). Although I don’t agree with Usoskin’s methodology or outcomes, I do thank him and Solanki for providing the graph. Note: If you havent read my basic theory on grand minima here is the link which will put things in perspective. http://landscheidt.auditblogs.com/2008/11/06/are-neptune-and-uranus-the-major-players-in-solar-grand-minima/

The original Usoskin graph did not have the green line or green filled areas, but suggested Grand Minima only occurred under the blue line, the area above the red line is considered grand maxima by Usoskin. I have re-jigged Usoskin’s graph by adding the green line to keep “Dalton like” events in the picture, raised the bar if you like, to leave out smaller grand minima doesnt make a lot of sense to me. I also tracked back independently grand minima events on a 172 avg year basis (Jose was not quite right) recording the angles of the Jovian planets which determines the strength of the grand minima involved (I chose the best N+U+J & S opposed lineup of that period, which is a window that comes along every 172 avg years, and most are the centre part of that period), this suggests we DO have a 172 avg year recurring Grand Minima event that have different levels of impact depending on their angular momentum at the time. This is a major break though, opponents of the theory have long suggested Usoskin’s graph disproves the planetary influence theory, how wrong they have been. I am also recording the grand maxima peaks and noticing a sublime correlation. Every major spike and trough in the planetary record correlates with the 14C records, including the modulation. Higher angular momentum corresponds with deeper troughs and higher peaks as cross checked by the angular momentum charts and thorough examination of the solar system positions at each point. Another spin off of this study is, so far the planetary positions are substantiating the accuracy of the 14C & 10Be record chronologically, at least up to -3666. The oldest 2000 years of the 14C record are taken from coral deposits, it will be interesting to see how that part of the record stacks up against the planetary positions.
The high peaks are grand maxima if you want to call it that and are basically SC18 & 19 happening before every grand minimum. These high angular momentum periods are from 1 or 2 planetary alignments that occur just before grand minima as the angular momentum builds every 172 avg yrs. There is an extremely strong correlation in cycle peaks and high points in angular momentum, and 1 alignment in particular is showing up. Note: As observed in past strong Grand Minima, solar cycles directly after the initial slowdown are shown to exhibit a very low output, thus there is no high angular momentum peaks during this time.
Observations suggest a Jupiter/Saturn angle of around +30 deg produces the deepest and most prolonged grand minima if the Neptune/Uranus angle is low (smaller gap between them), like the Sporer Minimum pattern above. Other variations can exist to produce a strong grand minimum but are rare. The Jupiter/Saturn angle when Neptune and Uranus come together is the key to the fluctuations in the 11000 year record and is anything but random as some suggest. In particular the warmer/active periods are dominated by very low or neg J/S angles. The J/S angle sets up the grand minima & maxima phase and governs how many “hits” a grand minima gets, which affects the duration and depth. This can include up to 6 hits using double combination’s of type A & B angular momentum disturbance. And all this and more is a simple creation of the probable infinite combination’s of angular momentum strength created by the angles of Jupiter & Saturn.
These are the 2 configurations ( angles vary slightly each time) that correlate on every occasion of Grand Minima for at least the last 6000 years. Type “A” is typically stronger than “B”, but when they double team as they did during the Wolf Minimum and others, it delivers a deep knock out blow for many years. Jupiter and Saturn provide the bulk of angular momentum to our Sun, but every 172 years on avg, Neptune and Uranus join forces and completely change the picture. Note: If we look at the path of the Sun as it moves around the centre of the solar system, there is 2 distinct patterns. A long gradual sweep away from the centre of the solar system, followed by a tight circular pattern close to the centre of the solar system, this is Jupiter and Saturn providing the bulk of angular momentum . Type “A” disturbances always affect the inner tight circular pattern, as shown later in this article.
The period between 0AD and 1200AD stands out, around the birth of Christ we have very weak J/S angles slowly increasing in strength as we move towards 900AD and the grand minima naturally follow the same trend. The J/S angles go from high positive to high neg between 961 and 1153 which leads us back into more type “B” territory. There is a trend in the J/S angles that follows the overall trend on the 14C chart. As we track back from 2010 we have good positive angles creating a golden era of grand minima, followed by a transition at the MWP then a run of not so good negative angles with poor minima right up to -394, where it returns positive for 4 cycles creating 2 big grand minima and then returning neg and backing off again etc. etc. With 3200 years plotted, only 2 areas raise some questions, around 600BC we see strong Type “A” disturbance not causing Grand Minima, most likely not following “Wilson’s Law” (J/S conjunction occurring before solar cycle max). This unleashes high momentum peaks that would otherwise be quashed by Grand Minima which corresponds with a high flat peak in the 14C graph. This is not seen at any other period on the 11000 year graph. Around 900AD there is a Grand Mimimum type trough with no corresponding angular momentum disturbance ( the only one). Korte & Constable [2008] who are a major component of Usoskin’s reconstruction of the 14C graph highlight 900AD as an era of possible error, and the 10Be graph does not show the same trend. This era was known for the settlement of Greenland incl vineyards etc suggesting higher temperatures, more research in this area is required.
During times like around 1000BC the angular momentum graph dramatically changes, with lots of weak disturbances spread across like a saw blade, making almost a continuous period of disturbance, but not enough to cause deep grand minima, but enough to make the saw tooth in the 14C graph….there is so many chances for small maybe single or double hit grand minima, but Type “B” disturbance is affecting a different path of the Sun compared to Type “A” and may be much less likely to cause solar slowdown for more than 1 solar cycle. Another area on its own to research. I think these occurrences are true Grand Maxima as they run for extended periods of time without deep grand minima.

SSB graph for -1300 to -900. click on the graph for larger view. Notice the multiple mostly weak disturbances mainly controlled by type “B” (red arrow) configurations, this is like no other period I have seen so far, the J/S angles creating far extended disturbances over 400 years, very different from recent patterns…this is real Grand Maxima, similar but stronger than the MWP
Jose calculated a 178.8 yr period, but going back through time I found the Jovian planets through changing positions altered that period. I have plotted 34 grand minima from 2010 to -3666 giving a total range of 5676 divided by 33 gaps = 172 years. But the Gaps can get down as low as 140 depending on alignments but the same basic grand minima pattern of N+U+J & S opposing is still in play, except sometimes its stronger early, other times late. The next step is to measure longitude of J+S compared to N+U at each conjunction of N+U, this might give a more accurate measure of the 172 yr period strength and eliminate 2 of the the previous variables.

-1200 to +1200 Angular Momentum graph Click on the graph for a full size view and then magnify. Angular momentum graph from -1200 to 1200 showing all Grand Minima opportunities (red & green arrows) and non Grand Minima affected high points (purple arrows) as shown on Graph 2 at top of article.

In the angular momentum graph illustrated above (-1200 to +1200 Angular Momentum graph), you will note the “camel hump” shapes (highlighted by the green and red arrows), which indicate angular momentum disturbances that differ greatly from the normal pattern. These are Grand Minima opportunities. Different versions of Type “A” & “B” disturbance that come along usually in groups of 3 every 172 years on avg, showing both strong and weak patterns. Type “A strong” is characterized by the “camels hump” showing midway through the cycle running towards J+S opposing (+25 to +60 deg). Type “A weak” is characterized by a small hump at the end of J+S opposing, caused by a very low J/S angle. Type “B strong” is as per Type”A strong” but is associated with a negative angle (-30 to -95deg). Type “B weak” shows J+S together with N+U dragging the height of the peak down considerably. Type “A” disturbances are generally far stronger (Grand Minima producing) than Type “B”. In a nutshell these configurations control the shape of the 14C curve with the most deep Grand Minima occurring around the times of strong Type “A” configurations. The strength of the disturbance and the shape of the “hump” is completely dependent on the J/S angle at the time. Each 172 years their angles changes slightly as the planets progress their allotted path.

The path of the Sun is altered by the extra momentum created by N+U. Here we can see the Sun entering the “chaotic” phase exactly at the same time as the disturbance on Carl’s SSB graph, which shows a reasonably strong Type “A”. There are predominately 2 path cycles, A larger outer cycle followed by a tighter inner cycle with each extremity of the cycle lining up with high and low points on the Angular Momentum graph, each taking roughly 10 years. A Type “A” disturbance affecting the inner cycle (making larger) and a Type “B” affecting the outer cycle ( creating a more shallow curve). The timing of the disturbance relative to the position of J+S being the key to Grand Minima strength. Thanks to Carsten. http://www.arnholm.org/astro/index.htm
There have been a number of studies using mathematical models to predict solar cycles incl: Sonett [1982], Damon and Jirikowic [1992], Vasillev and Dergachev [2002]and Clilverd et al [2005]. Clilverd’s work with repeating patterns has hit on the background repeating solar trend and predicts very similar outcomes to what we see from the angular momentum charts. Science has noticed the pattern but until now did not know what caused it. An interesting piece from Clilverd et al ” From long-term data such as the C14 series it is clear that low-frequency cyclic oscillations caused by solar activity are present [Stuiver and Quay, 1980; Neftel et al.,1981; Solanki et al., 2000; Beer, 2000]”
The Clilverd paper can be found here: http://users.telenet.be/j.janssens/SC24Clilverd.pdf
Jose is indeed the biggest contributor in the Planetary Influence field, and in my opinion deserves the naming rights for the next grand minimum. Others have followed on from his lead which started in 1965 including Fairbridge, Wood, Shirley, Landscheidt, Blizard, Sperber, Gokhale, Javaraiah, Charvàtovà, Zaqarashvili, Freeman, Hasling, Juckett, & Wilson, but perhaps they all missed the vital controlling factor, Neptune & Uranus. On the surface that sounds unbelievable and even I find it amazing planets that far away can have any influence, but I think we are all going to find out they indeed do.
Feel free to ask any questions, I encourage vigorous debate.
Here is some more 14C and 10Be data.

Stretch the data out a little and it all becomes clear…

14C and 10Be combined to show almost exact match, 14C black, 10Be gray..this graph is reversed and needs to be mirrored to align with previous graphs
I hope Carl is getting some joy from this, his original graph was the seed for this project.
Geoff Sharp.

Looking 20yrs either way from each Neptune-Uranus conjunction against the SSN graph reveals just over half can be seen to occur at low activity. Here are the center dates, lower activty periods are starred*
-2890
-2808
-2638
-2465
-2294*
-2123
-1951
-1780*
-1607*
-1436
-1265*
-1100*
-920*
-747*
-575*
-405*
-233
-62*
111*
282
624*
795*
965
1136
1307*
1478*
I think it would help if the graph line were kept vertical.
REPLY:Spot on Ulric, you are one of the few that understands whats going on, those dates you will notice are very close to mine being the N+U centre. Most of the low dates will coincide with positive J/S angles and ALL the rest will be exact inline with a downward trough, that is one heck of a correlation.We can also see the trend in your numbers that is the trend in the C14 graph. We need to keep in mind that grand minima can occur 40 years each side of the N+U conjunction, usually presenting 3 possibilities to back down the Sun during this time, that would add a few asterisks to your numbers. I was thinking of measuring the J/S angle at exactly the conjunction of N+U each 172 odd years to see a similar trend which is perhaps more accurate….do you know a very accurate ephemeris I could extract the exact angle out easily? I tried JPL but was useless for this sort of thing.
Hi Geoff,
maybe the swiss ephemeris?
http://www.astrolog.org/astrolog/astfile.htm
Keep it coming!
REPLY: I downloaded that today after reading your comment on solarcycle24 today, I havent worked out how to use it yet, do you know how far back it goes and its accuracy, they seem to be the show stoppers…..thanks for the support.
There seems to be a problem with comments in certain cases…trying to work it out. here is a comment from Tallbloke he emailed. Thanks for the help on that one rog….if that package works its a big help.
Geoff,
You’re welcome. It’s as good as it gets in the freely available as far as I know. If you download the astrolog executable too, you can get useful output. Best on a linux box, ten years ago I was running astrolog on a sun sparc BSD unix box and supplying it with command line params to run a realtime graphic planet clock on the desktop.
I’ll get another faster linux box set up soon and see whether we can get some output piped to a csv file or straight into a database. Meantime, download the windows executable and play with it in graphics mode, the animation capability is fun Hit ‘pause animation’ and then select jump factor etc. I haven’t bothered patching in the extra accuracy files as the basic astrolog program uses the concise swiss ephemeris and seems to do pretty well back to 5000BC or so. Go through the menus and select heliocentric and graphics view of the solar system orbits. Use the ‘restictions’ tab to eliminate irrelevant bodies. To get a scale, select the glyph size options. Clunky but useable.
Ulric might be able to tell us if his nice software has a better ephemeris, but maybe it’s the same one with a prettier interface?
I have high hopes for your work, and would like to assist.
Best
Rog
11 out of 25 N/U conjunctions are not not within +/- 20yrs of a trough in the graph. 40yrs either way clearly becomes a square rather than a syzygy, so is out of range for this theory. This global climate record is useful for checking on each period; http://www.geo.arizona.edu/palynology/geos462/holobib.html
Any other such climate record links for our studies would be very welcome.
Reply: So by your logic we can never have a grand minimum longer than 4O years?
Hey guys, keep up the good work – I really appreciate where you are going here.
If you are going to use astrolog to find planetary configurations, make sure you download and install the full extended High Accuracy Swiss Ephemeris, as contrary to opinion expressed above, astrolog’s internal ephemeris algorithms are NOT based on the Swiss Ephemeris, and are only satisfactory for a few hundred years past and future, as errors increase exponentially both ways from now and the results are increasingly useless the further you get from now.
The High Accuracy Swiss Ephemeris you download from the astrolog site is an 80 day interval subset of NASA JPL’s Horizons Online Ephemeris and is nearly as accurate, and by default if astrolog finds the right files in the correct location it will use the Swiss Ephemeris.
Read the extensive documentation that comes with astrolog carefully, as while it has a steep learning curve at first, it is quite comprehensive and you can configure it to do almost anything by inserting appropriate switch codes in the astrolog.dat file using any text editor.
Thank you for your valuable work and entertainment 😉 Although I have a lot of respect for Jose and his intitial work, I still think this minimum should be named after Landscheidt considering the fact his stood up in the face of the political machine of Maurice Strong et al, that is ‘AGW theory’.
I’m amazed at many of the commentors tenacity and effort who I see around the internet. I’m afraid I’m not going to be advancing Carl’s enquiry but I have put together a ‘short and simple version’ of the history of what I’ve come to call Barycentric Tide Theory (BT Theory). It is at http://www.itsonlysteam.com/articles/landscheidt_minimum_part2.html and please comment on credit not given or something way off base. I’ve also linked this site to a Theodor Landscheidt facebook page. I hope you don’t mind. I’ve caught a bit of a new audience there.
My pleasure…the tenacity from some commentators suggests a different agenda perhaps, It will take a lot of years for some to finally accept the planets indeed do control many aspects of the Sun.
I have a lot more data to release, everywhere I have looked suggests every movement on the 11000 yr 14C record corresponds exactly with the angular momentum graphs including times outside grand minima and maxima. Those opposing planetary influence will not be able to disprove. This is compelling information.
Thanks for the link, some interesting reading provided.
Geoff
You are struggling a bit around year -2000 an 1000. Also there is very often a min in between your minima. I played a little with the U+S&J cycle and it seems to work better around 1000 but failing again later. To me the U+S&J seems logical because then you have a good balance, minimizing the momentum making the Sun quiet whereas when you have a U+S+J this will ‘shake’ the Sun the most and we get warming.
Forgive me for not having read all your work if you have already delt with this.
Hi lgl, I am assuming you mean -2000 to -1000. I think it depends on how you look at it. If we look at the angular momentum charts for that period it is mainly dominated by type “B” configurations. This is something new and not observed on this scale during the last 2000 years. Type “B” domination’s tend to be a lot weaker and rarely provide deep grand minima, there is also a much wider spread of disturbance extending the normal 3 chance scenario that is presented in 172 yr cycles. I have looked at 2 troughs (there is very few) that fall outside of the 172 yr framework and both are a direct result of the extended type “b” configuration. I will have the angular momentum charts back to -3000 very soon, and you will see exactly what I mean. You will also see nearly every movement in the C14 charts corresponds with the momentum charts.
Geoff,
No one example is the 961 you have put both at around 900 and a little above 1000, and there is no real trough at 1150. But never mind, one can not expect a 100% match. Looking forward to following your work.
REPLY: Thanks…the MWP is a transition period of supreme interest, if we look back over 11000 years there is no period like it. It has the only missing downward cycle. But that might be expected, leading up to the most golden era. If you look at the momentum graphs of that period on earlier articles you can see exactly why it was so. Type “B” configurations are weak but so powerful in other ways.
You might try a Fourier transform on the C14, 10Be, and planetary momentum data and compare the results for matching periods. You might also run DSP correlation between the data sets as a function of time offset. If your hypothesis is correct you these tests should show something roughly matching a 172 year period.
REPLY: I have just recently contacted Dr. Usoskin requesting base data of his 14C graph. Hopefully soon I will have something to play with, but suspect this kind of match may be a little difficult. The timing of grand minima is not exact, having a 80 year window approx every 172 years, but I will attempt the exercise if I can obtain the data.
Have you seen this:http://www.surf2000.de/user/f-heeke/article1.html
REPLY: Yes I have read that before, but was good to read again. There have been some observations that back up the change in diameter and rotation speed of the Sun at times of Grand Minima. This time around we will know for sure.
Thanks for your comments Paul, some of the other cycles are interesting like de Vries, Gleissberg etc, but do not explain their cause. I suspect they are created from the regular pattern of grand minima which can vary because of the reasons I have laid out, but would love to hear anything that can explain those cycles.
I am not feeling vulnerable, but do notice how hard it is to get a point across…very very few people understand this stuff. I am surprised by the lack of understanding from intelligent people from the science arena. The theory needs to be spelled out clearly and distinctly in an attempt to wake them up.
Carl’s suggestion will work very well with working out what Jean-Pierre Desmoulins work has already done, and does well for tidal affects and 11yr periods. But its a different story when it comes to working out the complexity of what causes grand minima, there are many more variables involved.
Charvatova and a few others have made mention of the importance of Neptune & Uranus, but didnt see the ultimate lineup that is the key to the whole equation. Carl’s graph was what alerted me, its like a Rosetta stone.
Your calculations backup Andy’s 2nd Calc and tallblokes. They also agree with my observations.
We are in the perfect place to witness the show, and this Blog will be a big part of it. Hope you join us in the excitement.
Geoff
Geoff – good work – it looks very interesting. Did you ever read Dean G.A. Recent Advances in Natal Astrology (1977) – pages 492-515 deal with solar cycles and the impact of J/S & N over 4000 years on solar minima and found a very close correlation with no significant drift
REPLY: No, haven’t read that one, but sounds interesting…do you have a link?
Geoff, interesting stuff. I am not a scientist, rather an over the hill engineer but with a reasonable grasp of (old school) maths/physics, please allow me to make some comments/ ask questions
It seems to me to tighten up your graphs further you will inevitably end up requiring a super accurate model of the solar system. i.e a model that accurately takes into account ALL planetary orbital paths/interactions and masses/dimensions.
How accurate are current sources of information anyway?
Do other solar bodies e.g. planetary moons, the asteroid belt even passing comets have some small but significant contribution? Planets/moons themselves rotate on axes that dont align in the solar plane and precess, would that have any effect?
I presume you are basing your theories on gravitational calculations, however as sunspots are also a geomagnetic phenomem, might planetary geomagnetics also have some input – bearing in mind some planets have really wierd magnetic geometry.
Just some thoughts……(might be rubbish)
Keep up the good work.
Thanks Andy. The main source of information is Carl’s SSB graph which is calculated from the Jet Propulsion Lab (NASA) data base and I think would include all mass within our solar system. The 4 outer planets control 99% of the angular momentum acting on the Sun, so I am very confident in the information source. Other areas I could tighten up on include extracting the exact angles of Jupiter and Saturn at each 172 year phase and if I can obtain the base data for the 14C graph, match it against the angular momentum figures.
Paul, I havent seen that paper by Fairbridge. He indeed does hint strongly at the N/U factor.
“Planetary triggering of dynamic events on the Sun and Earth is believed
to operate primarily through exchange of interplanetary torques. Although
the Saturn-Jupiter pair (synodic lap: 19.859 yr) carry 86% of the angular
momentum of the Solar System, it is the synod of the two outermost giants
(Neptune-Uranus: lap 171.4095 yr) that acts as the primary trigger to a
sporadic ripple effect that propagates through the system. Other pairs (USL,
SJL, EVL, etc.) set up secondary ripples. The closest conjunctions are
extremely rare, but create a serial domino effect through the system.”
Charvatova also hints in her Fig 3 which is a similar attempt to match N/U planetary alignments with the 14C record.
But they both dont go on to match J+N+U with S opposing configuration which is where the crucial disturbances come into play, which Carl identified this in his graph http://users.beagle.com.au/geoffsharp/sunssbam1620to2180gs.jpg This configuration and the additional J/S together with U/N opposing configuration are the keys to grand minima and maxima. The quality of the J/S angle at the time determines the strength of the grand minimum.
“The 4 outer planets control 99% of the angular momentum acting on the Sun”
I’m not sure how that statement is justified. I did a rough calculation on gravitional forces exerted by planets on the sun (ignoring moons and actual diameters of bodies) and I got :-
1. Jupiter 74.26%
2. Venus 9.88%
3. Saturn 6.59%
4. Earth 6.29%
5. Mecury 2.32%
6. Mars 0.29%
7. Uranus 0.25%
8. Neptune 0.12%
So by my rough calc the “outer 4 planets” control 81.22%. Am I missing something?
I have never done the calculation myself, but have read it in papers several times…I will dig it up for you. I dont think its about gravity…I think you will find if your doing tide calculations, Venus and Jupiter have about the same tidal impact on the Sun. There are a whole lot of factors here, inner planets orbiting far quicker etc. Carl’s SSB graph is accurate as its taken from JPL and its crossed checked by Carsten’s Solar System Simulator program (the Sun goes into chaotic mode when there is angular momentum disturbance) and further cross checked by the actual position of the planets everytime.
Dr. Svalgaard has worked with Carl’s data like me, if there was a hint of error, he would find it….trust me.
Apologies Geoff!
I now see where I’m going wrong….
I first worked out the approx. tidal forces on the sun and got
1. Jupiter 34.73 %
2. Venus 33.28 %
3. Earth 15.25 %
4. Mercury 14.56 %
5. Saturn 1.68 %
6. Mars 0.47 %
7. Uranus 0.03 %
8. Neptune 0.01 %
9. Pluto 0.00 %
(Apparently, orbital angular velocity has no effect on tidal acceleration) So that ties in with your statement above…..
Must be about barycentres….I thought so I then worked out 2-body barycentre displacements
1 Jupiter 49.16 %
2 Saturn 27.06 %
3 Neptune 15.41 %
4 Uranus 8.31 %
5 Earth 0.03 %
6 Venus 0.02 %
7 Mars 0.00 %
8 Pluto 0.00 %
9 Mercury 0.00 %
Aha! Thats where the angular momentum variations come from! I then worked out the 2-body angular momentum variation
1 Jupiter 77.92 %
2 Saturn 17.27 %
3 Uranus 1.86 %
4 Neptune 1.76 %
5 Earth 0.56 %
6 Venus 0.54 %
7 Mercury 0.05 %
8 Mars 0.05 %
9 Pluto 0.00 %
So the Jovian 4 are responsible for 98.8% by my calcs!
Perhaps I should read more and think more before engaging mouth!
REPLY: Very impressive….go to the top of the class. But I suspect your second calculation is most likely correct. Neptune and Uranus in your third calc are way too low. They are not the main drivers but when teamed up they provide sensational disturbance.
This simulator displays the displacement well:
http://orbitsimulator.com/gravity/articles/ssbarycenter.html
Wow those graphs are brilliant. Haven’t been able to get online here for a while. Keep up the good work. Like the new look site. Ed
REPLY: Thanks Ed, Auditblogs has had severe disruptions over the past 2 weeks, but has now moved servers (same server as ClimateAudit). We also updated to the lastest version of WordPress. A lot of older picture files were lost in the process, but I am endeavoring to retrieve them.
Geoff
Geoff,
I must admit that I hadn’t been paying attention to the Landscheidt blog, but I was scanning through looking at what WordPress themes were being used and noticed that this one had recently changed, so I had to have a look and…
…wow! What a great site!
Sorry about the disruption, but the WordPress migration was a complete PITA and drove me nuts for ten days trying to work out how to fix the issues.
Anyway that’s over. Let me know if there are any further issues/requirements.
Edit: I’ve just altered the comment colour from light green to black. Now we can all read comments without eyestrain
Looking at Andy’s percentages for 2 body barycentre displacements jogged my memory of the displacement weightings Ray Tomes calculated for the way the planets pull the sun’s interior north and south as they orbit. The pull is due to the solar equator being inclined to the plane the planets lie in by around 7 degrees.
Note that the inclinations are to the solar equator, and that the
periods quoted are relative to the nodes of the orbit with the
solar equator, and so are a little different to normal.
Code:
Planet Mass Distance Period Inclination Acceler. Displacement
M D P I
Mercury 0.056 0.387 0.2408522 3.18 0.021 0.0012
Venus 0.826 0.723 0.6152078 3.75 0.10 0.039
Earth 1.012 1.000 1.0000417 7.14 0.13 0.13
Mars 0.108 1.524 1.880885 5.51 0.0045 0.016
Jupiter 318.4 5.203 11.86233 6.00 1.228 172.9
Saturn 95.2 9.538 29.4568 5.45 0.099 86.2
Uranus 14.6 19.182 84.016 6.36 0.0044 31.1
Neptune 17.3 30.06 164.802 6.36 0.0021 57.6
Andy’s figures for comparison
1 Jupiter 49.16 %
2 Saturn 27.06 %
3 Neptune 15.41 %
4 Uranus 8.31 %
5 Earth 0.03 %
6 Venus 0.02 %
7 Mars 0.00 %
8 Pluto 0.00 %
9 Mercury 0.00 %
Both sets of figures approximately agree that U+N=S and U+N+S=J
Ray Tomes also points out that the outer planets lie on the nodes of a 160 minute light speed wave emanating from the suns centre. This fact coupled with Frans Heeke’s observations about the proportionality between orbital distance, period and density/size indicate to me Harmonics are at work. This may help us understand how masses small in comparison to our central star can create such large effects on its activity, similar to the way a flagpole can be broken by small regular pushes at critical moments, which amplify its oscillations. Or the way a guitar string plucked can cause it’s neighbouring strings to oscillate.
The music of the spheres indeed.
On September 19th 2009 Jupiter will conjunct Neptune with Saturn exactly 150 degrees inconjunct. At that time of year the bodies will also be at their maximum declination north/south of the solar equator too. Almost exactly a year later on September 23rd 2010 Jupiter will conjunct Uranus with Saturn opposed. It will be interesting to see Geoff’s theory in action.
Geoff,
“Neptune and Uranus in your third calc are way too low”
I’m afraid you say so because it is what you believe and not because you have other calculations.
I believe this is pure gravity and the effect it has on the Sun’s acceleration so I believe Andy’s calculations 🙂
http://virakkraft.com/sun-orbit-ssn-v3.ppt
REPLY: Andy’s 2nd calculation looks to line up with Carl’s SSB graph, and others before him like Jose, Fairbridge, Landscheidt, Charvàtovà etc as well as agreeing with Carsten’s Simulator. The disturbance in Carl’s graph and the change in the retrograde path of the Sun in Carsten’s Sim would not happen with the Neptune/Uranus figures in Andy’s third calc?
Hi Geoff,
This might sound like a dumb question, but won’t all of the planets end up orbiting about the barycenter? And if so, and the Sun is taken off center by about one solar radius, then won’t the earth’s distance change by 1AU-1SR where SR=solar radius or 1,392,000/2km or 696,000km? If so, that’s a ratio of (149598000-696000)/149598000 or 0.99534753. The sun’s output at earth would change by a factor of 0.995347531384109^2 or 0.990716708 or about 1%. Huge. So 1% of 1374W/m^2 (I think that’s close) =13.74 W/m^2. Also huge… I must be missing something since we would undoubtedly notice such a change… That will serve as my admission of ignorance for the day… Thanks.
REPLY: Hi Michael, Its a good question, but the Earth orbits around the Sun, so there is no difference in energy received based on distance. This can be quite different when our orbit changes to a more eccentric ellipse as seen every 100,000 years with coinciding ices ages. This orbit change is seen to be a result of the outer giant planets… also the SSB can be 2.2 solar radii away from the centre of the Sun.
Michael,
adding some of my ignorance perhaps. Half a year later the sign of this 13 W would change because the Sun does not not move much in 6 months, so the yearly average would be about the same. The time of year when it peaks should be of some importance however.
“as well as abolishing the so called solar TSI floor”
A certain authority had the B sub Z floor at 4.6 nT, it is now less than 4.1. The reconstruction of the heliomagnetic field is central to the argument for constancy.
The assumption that the smoothed statistics of SS, radio flux, and aa or ap indicies can all be cross-correlated without a mapping and transforms is hard to make where they go to zero.
Someone skipped class during functional analysis to program.
Its fine to do a reconstruction of the TSI using proxy records, but we have never measured it during a grand minimum. This one coming is just a small one, I wonder what it would read if we could go back in time to the Maunder. We might still get some interesting measurements in the coming years.
So am I missing something or was the Ap index for 3/6/09 (UTC) 1.125? If so again am I missing something or is that the lowest in recorded history?
tallbloke,
Since I got us banned at Anthony’s perhaps we can continue here.
Would it be correct to say the planets do not orbit the SSB, each of them orbit the individual Planet-Sun barycenter?
I think that will be in line with your statement that the Earth shifts with the Sun but Jupiter dont.
Pingback: The VENT » Blog Archive » It’s the Sun, Stupid
Greetings to All,
I will address 6 points.
1. Should we not be differentiating between minima & grand minima?
2. Are we tossing away the notion of a de Vries (~210a) cycle? 1/172a goes out of phase with 1/210a pretty rapidly – this has the potential to attract ridicule from hostile camps.
3. Should we be leaving ourselves so vulnerable to criticism by relying so heavily on qualitative descriptors & variables (e.g. “type A, strong”, “A in conjunction with B apposed to C square to D at time t”, etc.) where it is often (but not always) feasible to also (i.e. additionally) summarize & communicate quantitatively?
Landscheidt’s “moving variances” were a step in the right direction from working with piles of diagrams and I am sure that were he still with us, he would have introduced further refinements, realizing that measures like variance are appropriate for random time series (but not necessarily ideal for deterministic ones).
Carl’s suggestions in posts #6 & #8 in the “Neptune and Uranus Control Grand Minima & Solar Modulation?” thread can probably help us achieve increases in mainstream understanding, appreciation, & acceptance.
http://landscheidt.auditblogs.com/2008/11/06/are-neptune-and-uranus-the-major-players-in-solar-grand-minima/
Clarification: I’m not suggesting we eliminate the use of qualitative descriptors & variables, but I think Carl makes an important point.
4. Regarding the claims/conjectures (a) “There is so much new research in here…” and (b) “…perhaps they all missed the vital controlling factor, Neptune & Uranus”, I think we should acknowledge that Ivanka Charvatova published something very similar in 1988 & 1990. The references appear in post #24 in the “Neptune and Uranus Control Grand Minima & Solar Modulation?” thread.
http://landscheidt.auditblogs.com/2008/11/06/are-neptune-and-uranus-the-major-players-in-solar-grand-minima/
5. Regarding the exchange about orbits (beginning with post #27 in this thread) – for some insight read the “16 June. Australia” entry at http://nzclimatescience.net/index.php?option=com_content&task=view&id=80&Itemid=1
This was in relation to the error in:
W J R Alexander, F Bailey, D B Bredenkamp, A van der Merwe and N Willemse. 2007. Linkages between solar activity, climate predictability and water resource development. Journal of the South African Institution of Civil Engineering. Vol 49 No 2, June 2007, Pages 32–44, Paper 659.
Click to access alexander2707.pdf
6. Regarding planet weightings in solar inertial motion (SIM) calculations: Weightings are based on mass*radius. For SIM based only on jovian planets, the proportions are roughly:
J: 0.492040568
S: 0.271368831
U: 0.083192461
N: 0.15339814
I am very pleased to see this blog so alive and healthy – this is great! Thank you Geoff, Carl, & others!
Regards,
Paul.
Thanks for the prompt reply Geoff.
I would say Charvatova was pointing straight at U-N in 1988 & 1990 – for example figure 3, as well as in the conclusions, in
Click to access nph-iarticle_query
Fairbridge was also leaning towards U-N in 1995 – particularly see his last 4 paragraphs:
Click to access 9501078v1.pdf
Landscheidt was basically looking at the same thing in his “New Little Ice Age?” paper – but he was using a different approach (that isn’t perfectly suited for working with deterministic series – although it succeeded (importantly) in opening a lot of eyes).
More variables is not so much of a problem in the era of customizable spreadsheets. I had found the U-N pattern independently before I read Charvatova’s paper. I thought I might have something new, so I was impressed to see that she had it 2 decades ago. The one thing that puzzles me is that many still speak of a 179a cycle without mention of U-N. I am reassured – & delighted – to see this blog agreeing with my independent assessment. In hindsight it’s not so surprising to see that many of us are reinventing the same wheel, considering how well-blocked this type of work is from the mainstream. I wonder how many others have traveled these paths before us?
Geoff, can you clarify for me which graph you mean when you say “Carl’s graph”? I want to be able to appreciate your comments better – and there are a lot of interesting graphs! (and I’m new here, so I’m not sure if you are referring to an earlier thread). Thanks!
I’ll consider tackling your comment about de Vries & Gleissberg cycles another day. For now I’ll report that your comment is for-the-most-part compatible with my latest quantification efforts.
Regards,
Paul.
Hi Geoff & Others,
I believe Ivanka was using her epsilon & delta parameters as an alternate means of quantitatively describing what you are describing with words & logic. J-S is central to her argument. However, the pdf format seems to have impacted the quality of figure 3 – and the explanation in the text is both terse & technical.
It is the non-linear amplification of the weightings of the various components of SIM variants (e.g. distance, rate of change of angular momentum, etc.) that camouflages “camel-like” features. I remember my introductory experience, staring at Jose’s (1965) paper, discerning S-N wiggles – that’s what got me onto a lot of the tangents I have explored.
The challenge in reaching a mainstream audience will be to summarize the patterns of interest with one clean, quantitative variable (regardless of the complexity). It appears, however, that the most difficult step may have been overcome: i.e. recognition of the morphology.
We may agree to disagree on interpretation & significance of Dr. Charvatova’s paper, but we are certainly in agreement about the significance of the camel-like features. I commend Carl for drawing attention to them – and I am very thankful to have a place to discuss this research.
Regards,
Paul.
Hey! You’re back from the dead! (The site that is)
Looks like the Japan Society of Energy and Resources (JSER) are on the case!
http://www.theregister.co.uk/2009/02/25/jstor_climate_report_translation/
Finally some big guns taking sunspots seriously!
(Having just posted some comments on reports about the IPCC latest missive, I can assure you that AGW is a now a fundamentalist religion with a hardy bunch of Mullahs who will strike down anyone who dare blaspheme against AGW!)
“His harshest words are reserved for advocates who give conjecture the authority of fact.”
You couldn’t have found a more effective way to encourage sober comment in this forum AndyR.
Paul.
Hi folks, thought this might be of interest. MAJOR BREAKTHROUGH IN SUN-WEATHER RELATIONS announced at New York Climate Conference.http://co2sceptics.com/news.php?id=2977
EDIT: Looks very interesting Ed, if you come across any further information let us know. I will keep a lookout also.
I wrote a blog on this a few days ago.(here)http://blog.chess.com/Rickj/more-on-the-maunder-minimum) I’m becoming more and more convinced about this, and if the theory about cloud formation is correct, we can expect a lazy sun to let in more cosmic rays and hence more clouds, leading to increased precipitation. It would be interesting to see the following things
rainfall data and the link to planetary position
dendrochronological data and the link to planetary position.
I’m no expert though, so thank goodness there are some people out there who are.
All very interesting.
REPLY: The 11000 yr 14C graphs are based on dendrochronological data. The oldest 2000 yrs or so are coral readings, then tree samples and the last century is Wolf sunspot numbers.
Thank you richard – new things to think about often result in the breaking of old roadblocks.
3 comments:
1) It would be helpful if all of the wavelet plots used the same date-scale & orientation – and if you included an outline of the cone-of-influence.
2) The cone-of-influence does extend down to low-timescales towards the date-extrema, but magnitudes *not influenced by estimated extensions of the data set (for example by assuming repetition or padding with zeros) can be trusted.
3) There will always be blue (with your color-coding) on either side of a global (or high local) maximum in a time-series because it pulls window-averages up for all timescale-bandwidths, so the way I read your plot is “we just had high activity at the end of the 20th c”. We’ll have to wait *many years before we get past the “guesses” in the cone-of-influence – I don’t even plot them since the assumptions that go into them can be pretty unrealistic for most of the time series I encounter. Nonetheless, those are *great* plots – and you got me thinking! Thanks!
I really appreciated the link to the blog on Vukcevic’s ideas. It’s good to know there are electrical engineers on the case – they’re bound to stir up some new ideas. The problem is interdisciplinary and no one discipline is going to solve this puzzle independently.
Regards,
Paul.
Paul,
“Are we tossing away the notion of a de Vries (~210a) cycle?”
Yes, that’s a show stopper. But the 172 yr is referred to the Sun. What if we change the reference frame? Seen from the Earth the Moon make approx. 13 revolutions in a year, but seen from the Sun it only makes 12 rev. a year, Sun-Earth-Moon line up 12 times. What if the SSB is revolving around another ‘fixed’ point and the time to orbit is 200 years. Seen from the Sun Ju and Sa line up 10 times in 200 years, but seen from the fixed point the Sun, Ju and Sa would line up only 9 times in 200 years. 200/9=22.22, an interesting number. Do we know that the Sun-Planets barycenter is the ‘real’ barycenter? There could be a lot of mass in the Ort cloud creating an offset.
Re de Vries period, lgl says:
“…that’s a show stopper. But the 172 yr is referred to the Sun.”
I disagree with you on the former point, but I agree that U-N warrants consideration.
As for the acoustic exercise you present, I may be more curious about this demonstration if you have something specific to share.
“notice how hard it is to get a point across…very very few people understand this stuff. I am surprised by the lack of understanding from intelligent people from the science arena.”
Science has stopped to assess now that 24 has slapped them awake, note de Jager’s latest paper vs. the one with Versteegh 2004.
But remember, de Jager is an astrophysicist, his career over coauthoring papers with junior acquaintences. Any solar physicist you convince right now will recast your work in his image for the upcoming grant cycle. You are unlikely to benefit or be acknowledged, just be aware.
For cycle 24 solar physicists characterized Rmax as the only feature of importance as it was the one parameter they felt confident in predicting. Failure doesn’t normally inspire courage, at least don’t expect their pattern to change quickly. After 26 Rmax, more likely.
Some few are constitutionally incapable of interest in ideas other than their own.
REPLY: Thanks Gary, being new to this arena I have found it slightly amusing and have noticed the traits you describe. If from more research I end up publishing something, I know who’s name will be first on the paper 🙂
I have been coming across a few reports lately that show 200 year trends. I found this graphic interesting as it shows where and how the trend varies….perhaps this 200 year cycle is just a rough guide.
http://www.iop.org/EJ/article/1538-4357/605/1/L81/17353.fg2.html
In this report they talk about how the cycle varies through Milena, sometimes its 150 years etc. The Dalton is 210 yrs away but the next grand minimum after this will be 170 yrs away. The pattern varies depending on the J/S angle of the era which follows its own pattern of strength. The important thing is the downturn is seen on a regular basis, with only the MWP standing out. That pattern averages between 150-200 years, its impossible for the solar system to follow a very rigid regime, but we can bank on Neptune and Uranus coming together every 171 years, the position of Jupiter & Saturn is the variable.
There are so many reports showing this pattern, they use 14C, 10Be, Auroral records, Sunspot counts,Wave marks etc, but the common link is a recurring pattern. This is the greatest challenge to the Babcock theories that rely on a random number generator to explain cycle modulation and grand minima.
I note that you say “grand minima type angular momentum that comes along roughly every 172 years”. In February 1990 when I presented my paper “Towards a Unified Theory of Cycles” at the Foundation for the Study of Cycles Conference, I stated that the 179 year cycle was only a single interval that was sometimes 159 years and that the average interval must be the U-N synodic period of 171.4 years. Landscheidt took issue with this and did not seem to understand that you cannot have long term repeated configurations of J-S-U-N at 179 year intervals because U-N must get out of step. See http://www.cyclesresearchinstitute.org/tomes/tomes_unified_cycles.pdf for the paper I gave there.
EDIT: Hi Ray, welcome to the site. I have read a lot of your work. You have stated exactly what I have found, when looking back over the last 6000 years of the 14C record I was looking for a recurrence of a particular planetary lineup (J/N/U together with S opposing) and started back from today in regular 178.8 yr intervals but very quickly found that only worked for a few hundred years. Jose probably didnt go back far enough. The U-N synodic period is the real cycle.
Pingback: 2012: doomsday or new day
Hi
This is way technical for me, just a simple question, will the peak of the current solar cycle 24 be of extremely high solar activity (in terms of flares/CME/X-rays etc) if you look at graph1 ?
please reply, thanks
REPLY: I am not sure I agree with the last 50 years of Usoskin’s reconstruction but the trend is steadily on the decrease now. SC24 overall should be very weak, but that doesnt mean there wont be the odd CME of high strength…this has happened in other quite times.
Ray Tomes, Have you looked at the recent works of Russian scientist Yu.V. Barkin? Geoff, have you?
REPLY: Not sure I have,…. link?
Thanks Gary for sharing
WORDPRESS MIGRATION
Do you mind if I quote a few of your posts as long as I provide
credit and sources back to your site? My blog is in the exact same niche as yours and
my visitors would definitely benefit from a lot of the
information you provide here. Please let me know if this alright with you.
Thanks a lot!
No probs.
Geoff